Free Access
Fig. 10
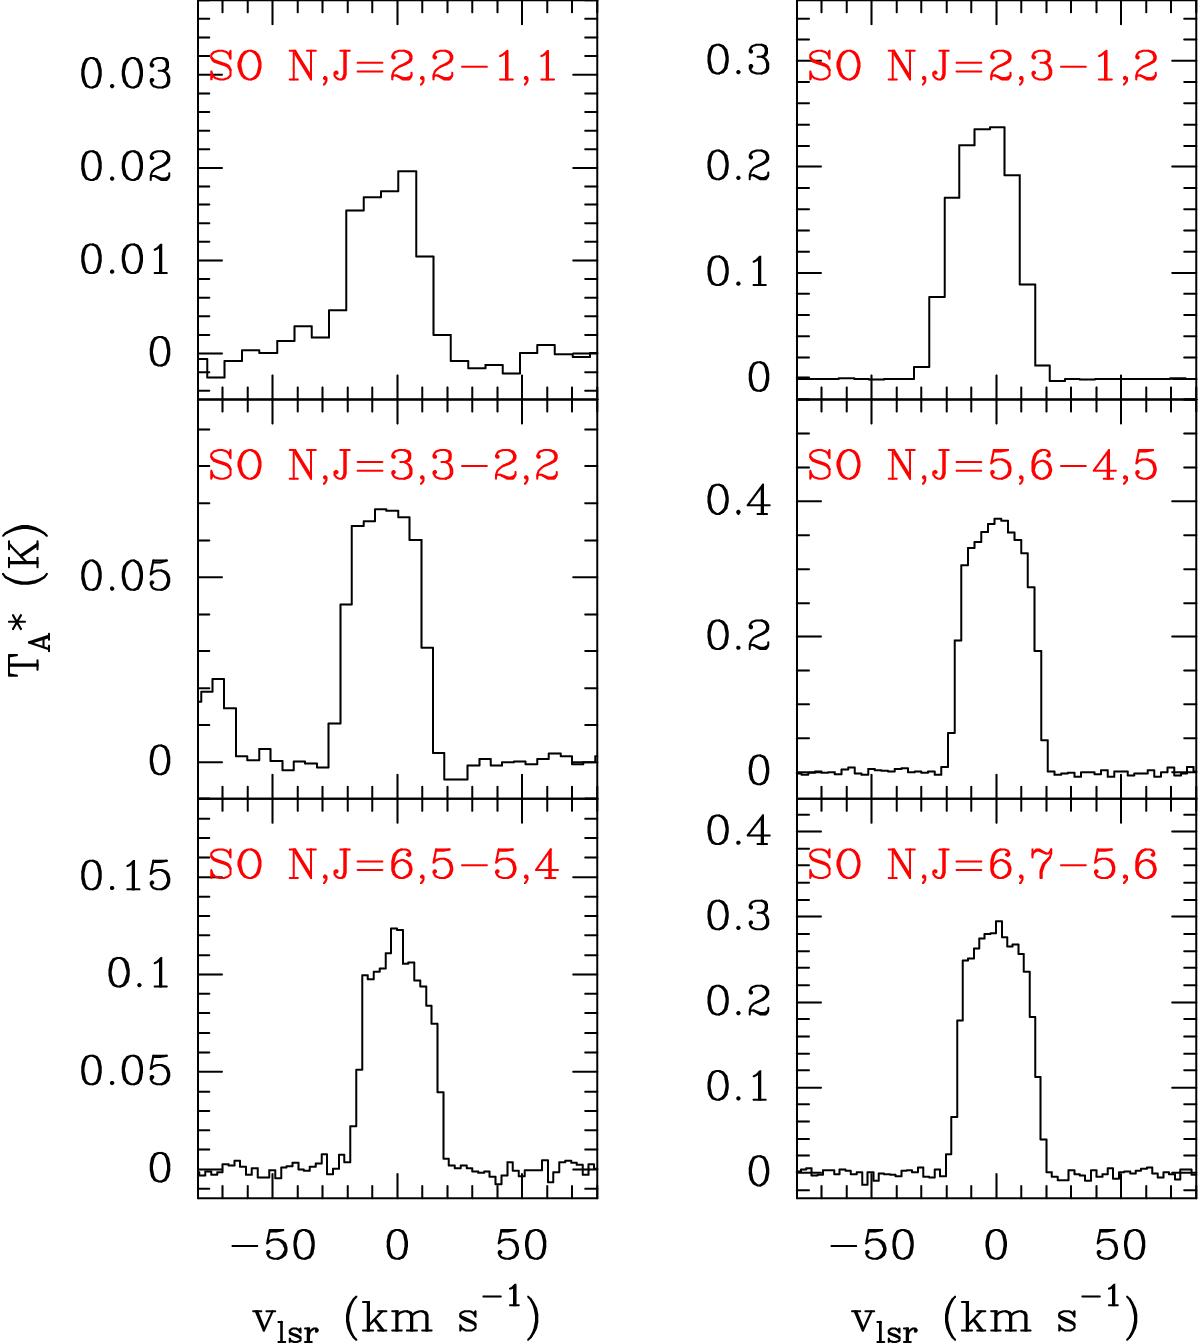
Line profiles of some of the SO lines identified. The quantum numbers of each transition are plotted in red in each box.The spectral resolution is 2 MHz for all the spectra shown.
Current usage metrics show cumulative count of Article Views (full-text article views including HTML views, PDF and ePub downloads, according to the available data) and Abstracts Views on Vision4Press platform.
Data correspond to usage on the plateform after 2015. The current usage metrics is available 48-96 hours after online publication and is updated daily on week days.
Initial download of the metrics may take a while.