Fig. 9
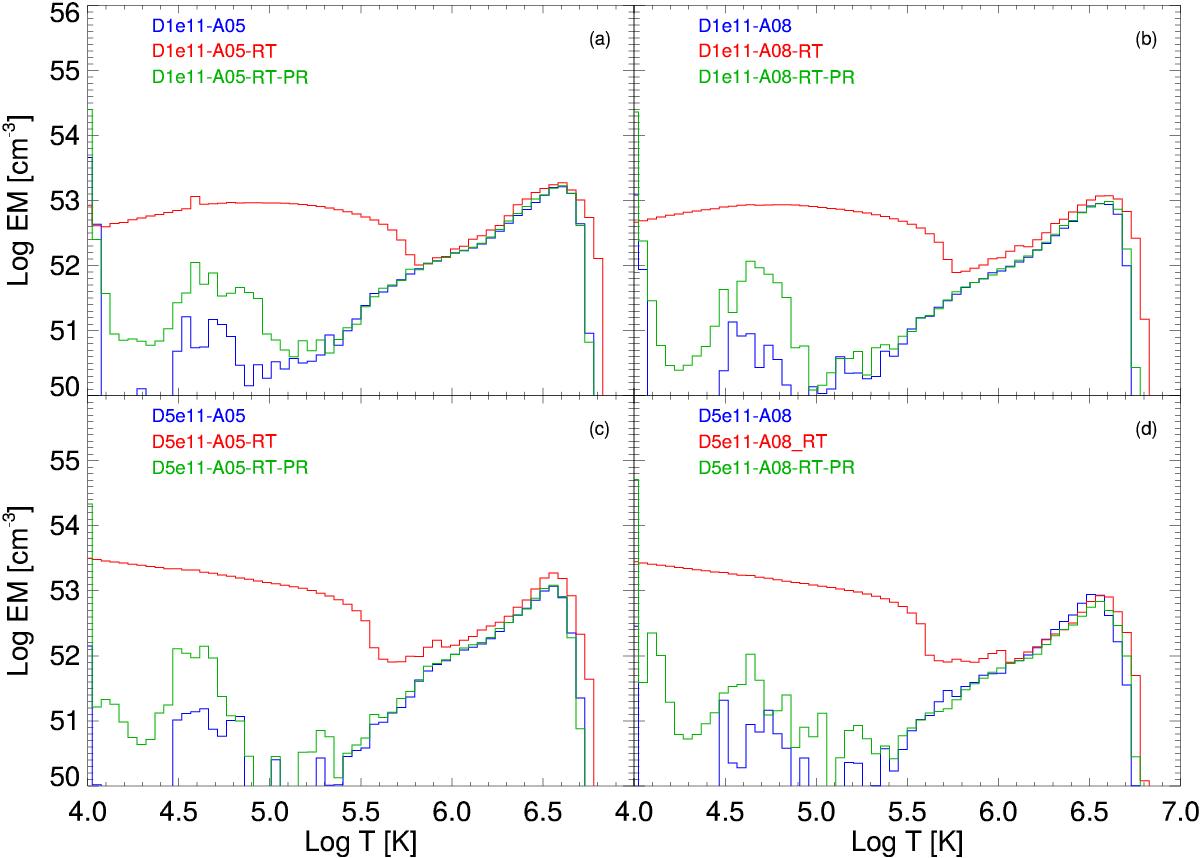
Emission measure distributions versus temperature for models with stream density nacc = 1011 cm-3 (upper panels) and nacc = 5 × 1011 cm-3 (lower panels). The figure shows the EM(T) derived for models either with (red and green lines) or without (blue) radiative heating and models either including (blue and green) or neglecting (red) the radiative losses from optically thin plasma in the unshocked stream.
Current usage metrics show cumulative count of Article Views (full-text article views including HTML views, PDF and ePub downloads, according to the available data) and Abstracts Views on Vision4Press platform.
Data correspond to usage on the plateform after 2015. The current usage metrics is available 48-96 hours after online publication and is updated daily on week days.
Initial download of the metrics may take a while.