Free Access
Fig. 8
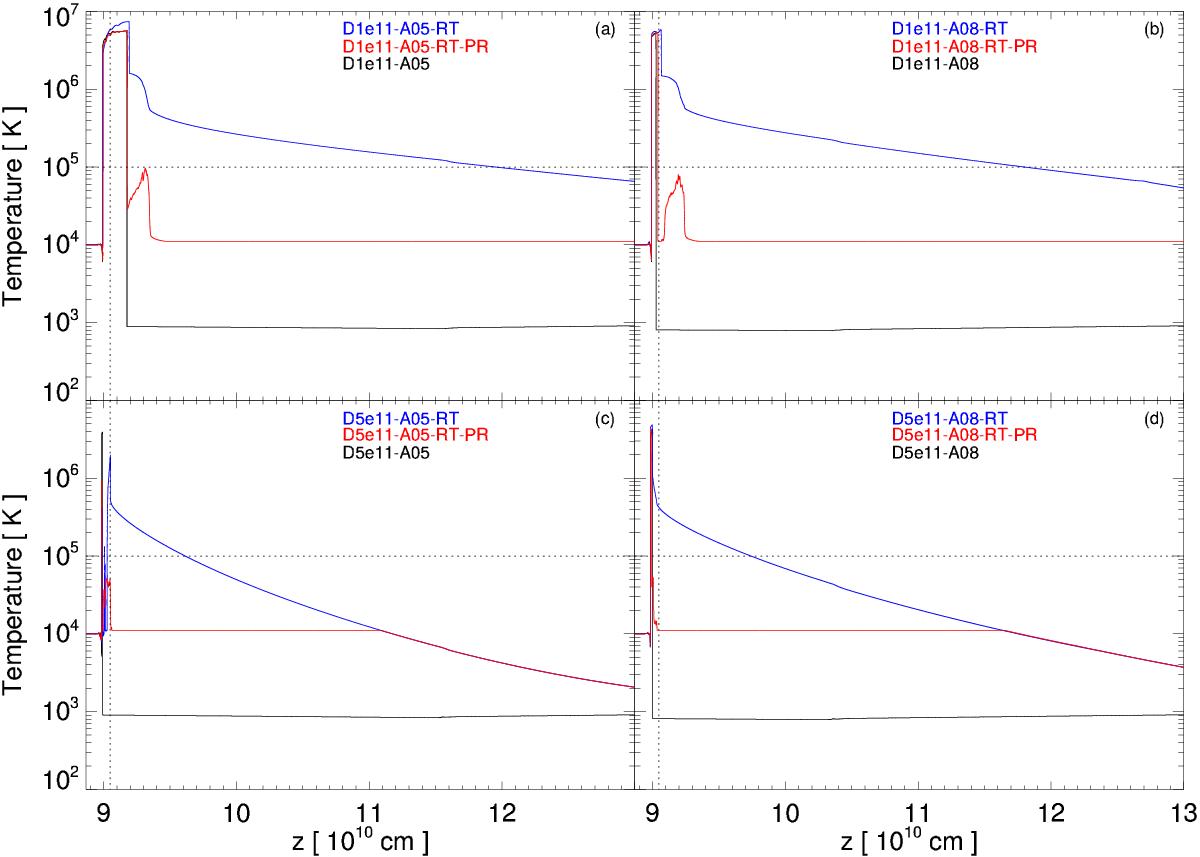
Temperature profiles for models with stream density nacc = 1011 cm-3 (upper panels) and nacc = 5 × 1011 cm-3 (lower panels). The vertical dashed lines mark the position of the stellar transition region, the horizontal dashed line indicates a temperature of 105 K.
Current usage metrics show cumulative count of Article Views (full-text article views including HTML views, PDF and ePub downloads, according to the available data) and Abstracts Views on Vision4Press platform.
Data correspond to usage on the plateform after 2015. The current usage metrics is available 48-96 hours after online publication and is updated daily on week days.
Initial download of the metrics may take a while.