Fig. 4
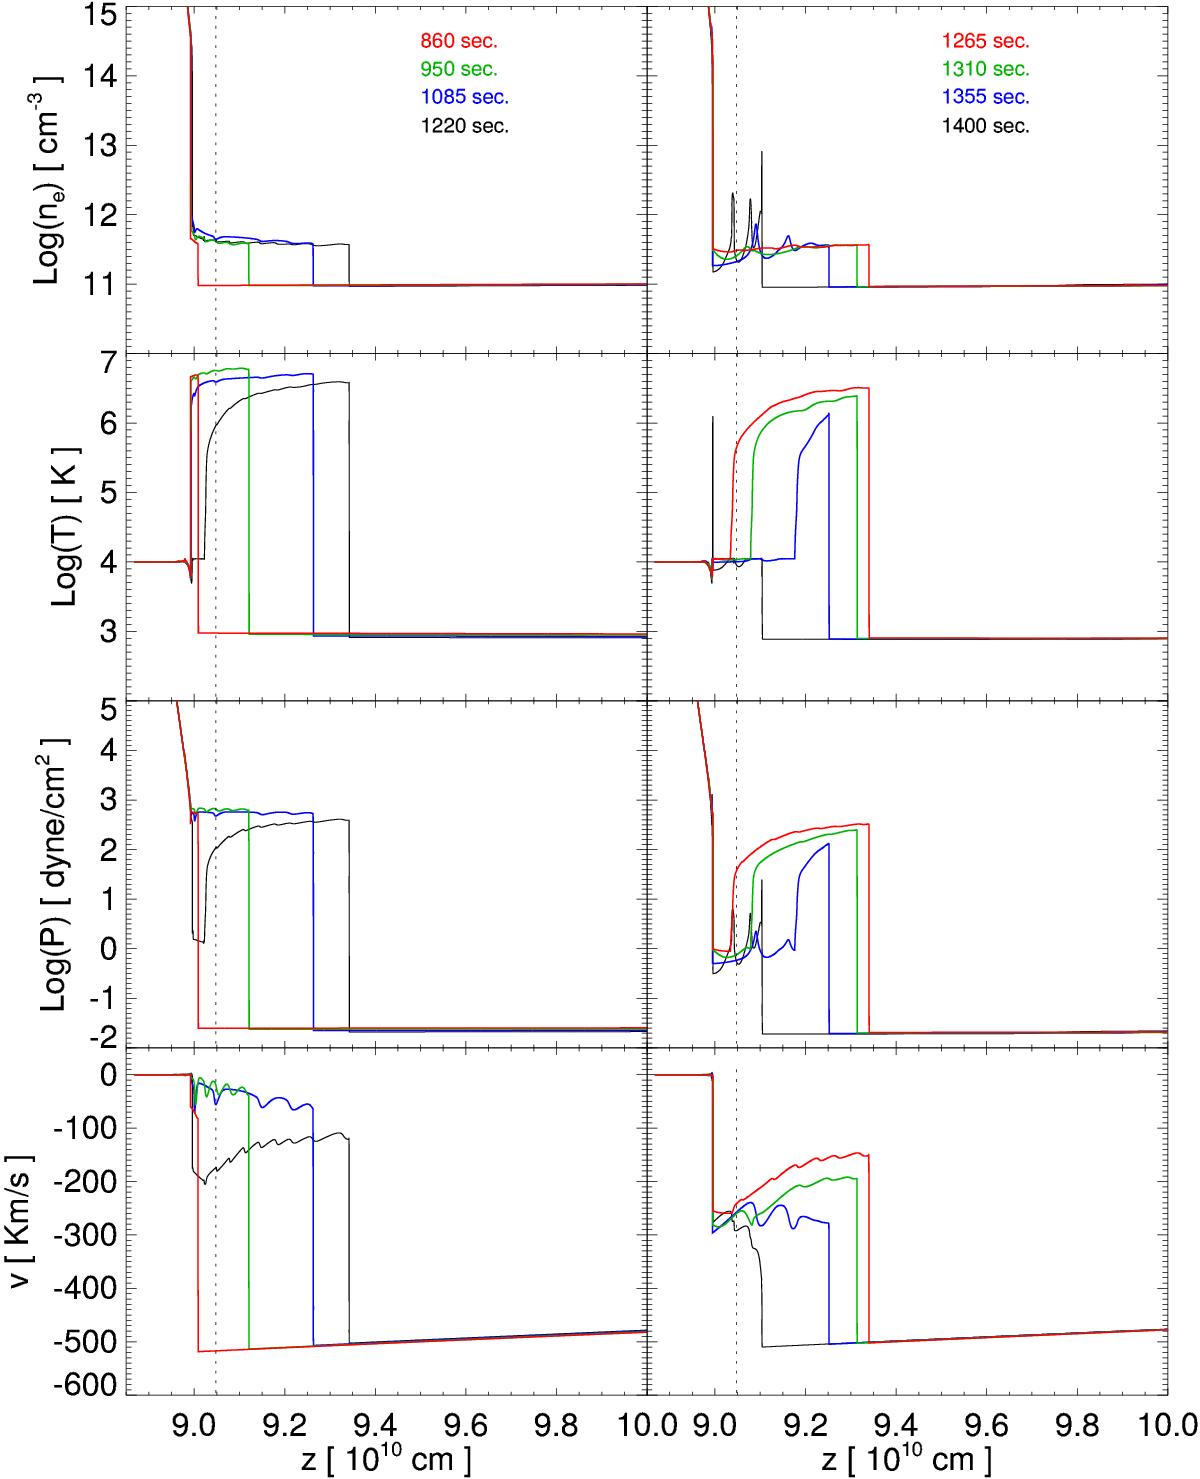
Time evolution of plasma density, temperature, pressure, and velocity of the post-shock plasma in the case of the model D1e11-A05. The panels on the left show the expansion phase of the slab, while the panels on the right show the collapse phase. The vertical dashed lines mark the position of the unperturbed transition region.
Current usage metrics show cumulative count of Article Views (full-text article views including HTML views, PDF and ePub downloads, according to the available data) and Abstracts Views on Vision4Press platform.
Data correspond to usage on the plateform after 2015. The current usage metrics is available 48-96 hours after online publication and is updated daily on week days.
Initial download of the metrics may take a while.