Fig. 2
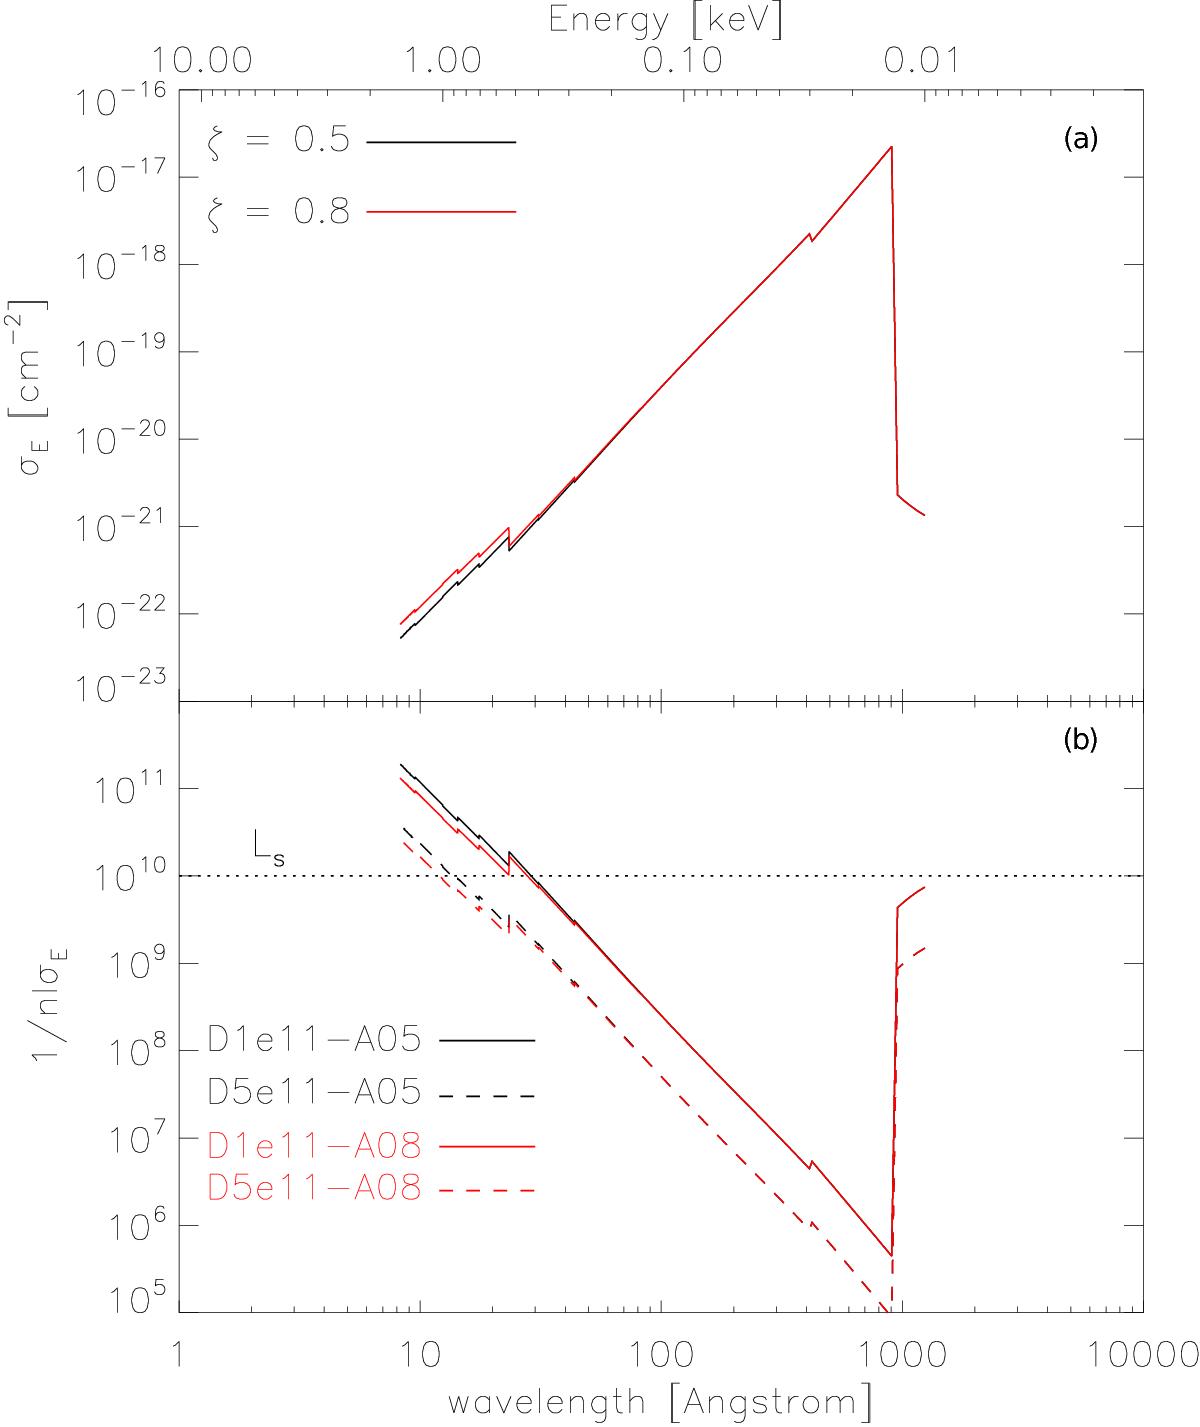
Top panel: photonionization cross section as a function of the wavelength from the PINTofALE library (Kashyap & Drake 2000), assuming a heavy element abundance of 0.5 (black line) and 0.8 (red line). Bottom panel: mean free path as a function of the energy, for the two densities used in our models (solid line for nacc = 1011 cm-3, and dashed lines for nacc = 5 × 1011 cm-3). The dotted horizontal line (Ls) indicates the characteristic length of the accretion stream equal to its section radius.
Current usage metrics show cumulative count of Article Views (full-text article views including HTML views, PDF and ePub downloads, according to the available data) and Abstracts Views on Vision4Press platform.
Data correspond to usage on the plateform after 2015. The current usage metrics is available 48-96 hours after online publication and is updated daily on week days.
Initial download of the metrics may take a while.