Fig. 9
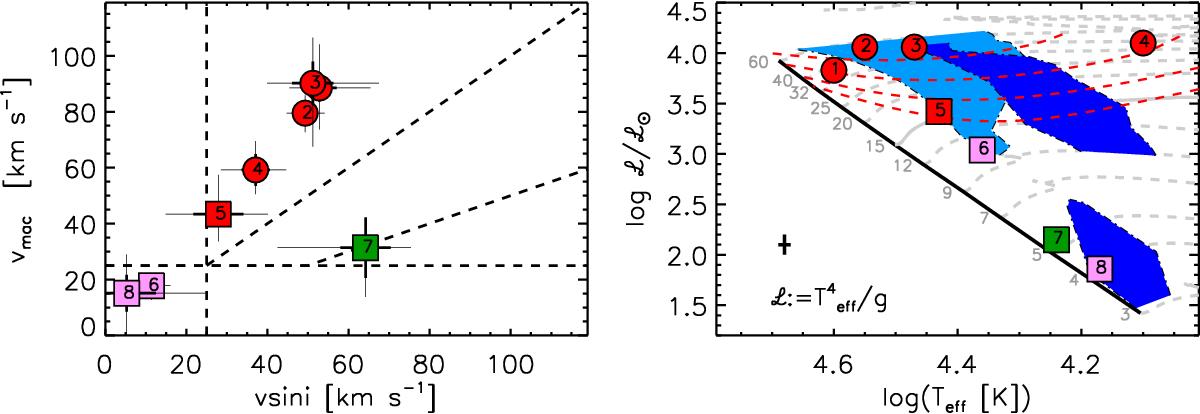
Location of the 8 stars discussed in Sect. 5.2.3 in the ν sin i – νmac, and sHR diagrams. Same color code as is previous figures. The four pulsating or spotted B main-sequence stars considered by Aerts et al. (2014) are identified with square symbols, while the remaining OB stars surveyed by the IACOB project, with still unknown pulsational properties, are indicated with circles. The cyan and dark blue shaded regions in the sHR diagram indicate the instability domains for heat-driven p and g modes, respectively, with ℓ = 1 computed by Godart et al. (2016). The dashed red lines in the same figure indicate the isocontours of the quantity Pturb(max)/P as computed by Grassitelli et al. (2015a).
Current usage metrics show cumulative count of Article Views (full-text article views including HTML views, PDF and ePub downloads, according to the available data) and Abstracts Views on Vision4Press platform.
Data correspond to usage on the plateform after 2015. The current usage metrics is available 48-96 hours after online publication and is updated daily on week days.
Initial download of the metrics may take a while.