Fig. 7
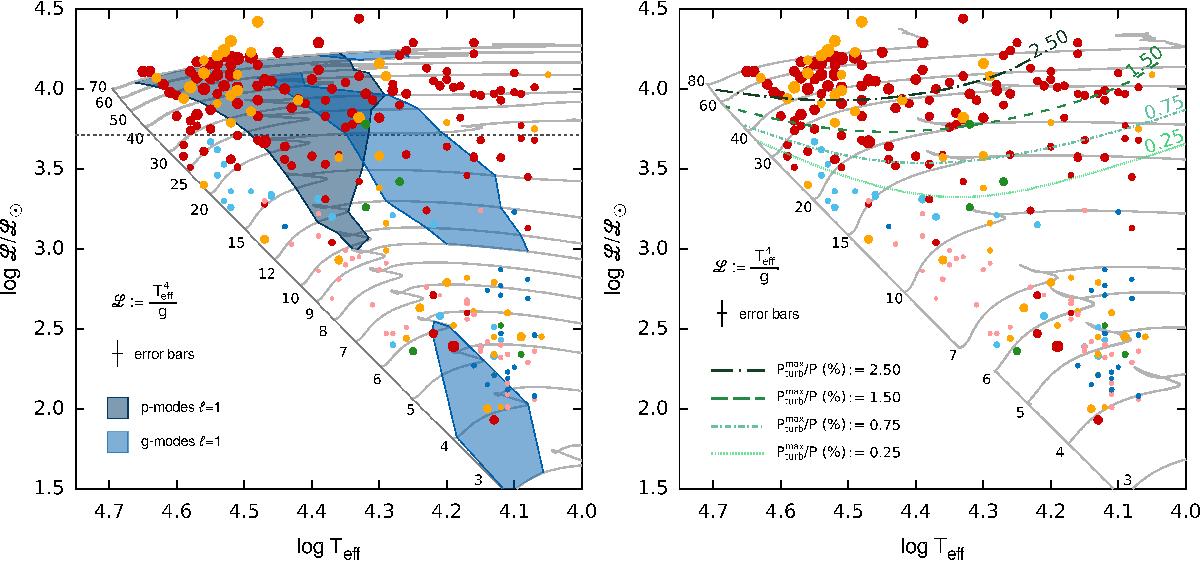
Model predictions for (left) heat-driven p and g modes with ℓ = 1 computed by Godart et al. (2016), and (right) the maximum fraction of turbulent pressure over total pressure as derived by Grassitelli et al. (2015a). Same observations as those included in right panel in Fig. 5, with the color code described in Sect. 4.1 and symbol sizes proportional to νmac. Each panel considers different evolutionary tracks for coherence with the models considered in the original papers performing the computations.
Current usage metrics show cumulative count of Article Views (full-text article views including HTML views, PDF and ePub downloads, according to the available data) and Abstracts Views on Vision4Press platform.
Data correspond to usage on the plateform after 2015. The current usage metrics is available 48-96 hours after online publication and is updated daily on week days.
Initial download of the metrics may take a while.