Fig. 5
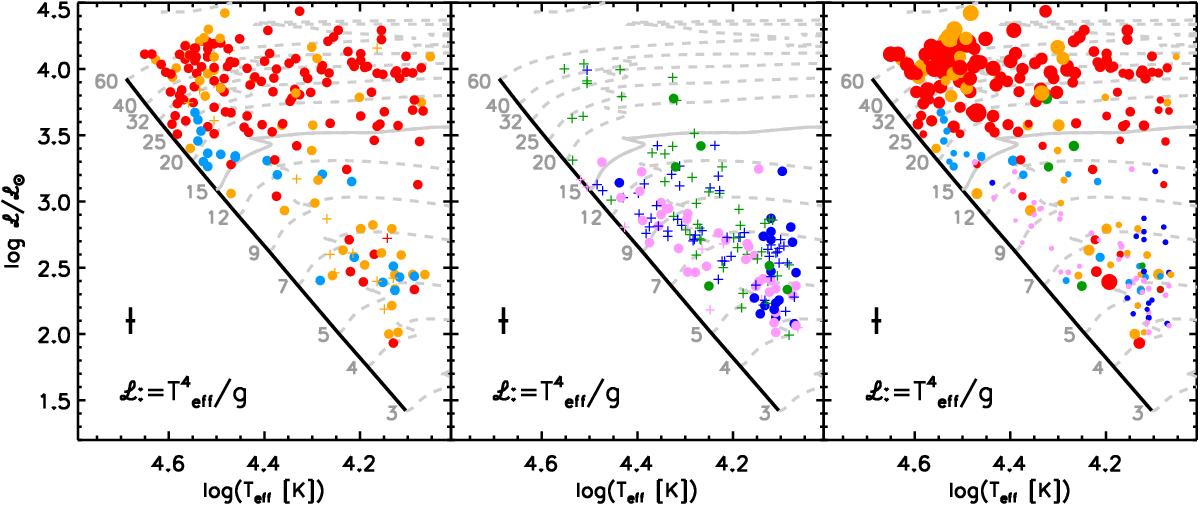
Location of the stars from groups A (left panel) and B (middle panel), as defined in Sect. 4.2.1, in the sHR diagram. Same color code as in Fig. 4. The Geneva, non-rotating evolutionary tracks (Ekström et al. 2012) are overplotted for guidance purposes. The black cross to the left shows the typical uncertainties in log Teff and log L (assuming conservative uncertainties in Teff and log g of 5% and 0.15 dex, respectively, and no correlation between both quantities). (Right panel) All stars from groups A and B (except those for which νmac could not be properly determined) joined together with symbol sizes proportional to νmac.
Current usage metrics show cumulative count of Article Views (full-text article views including HTML views, PDF and ePub downloads, according to the available data) and Abstracts Views on Vision4Press platform.
Data correspond to usage on the plateform after 2015. The current usage metrics is available 48-96 hours after online publication and is updated daily on week days.
Initial download of the metrics may take a while.