Fig. 4
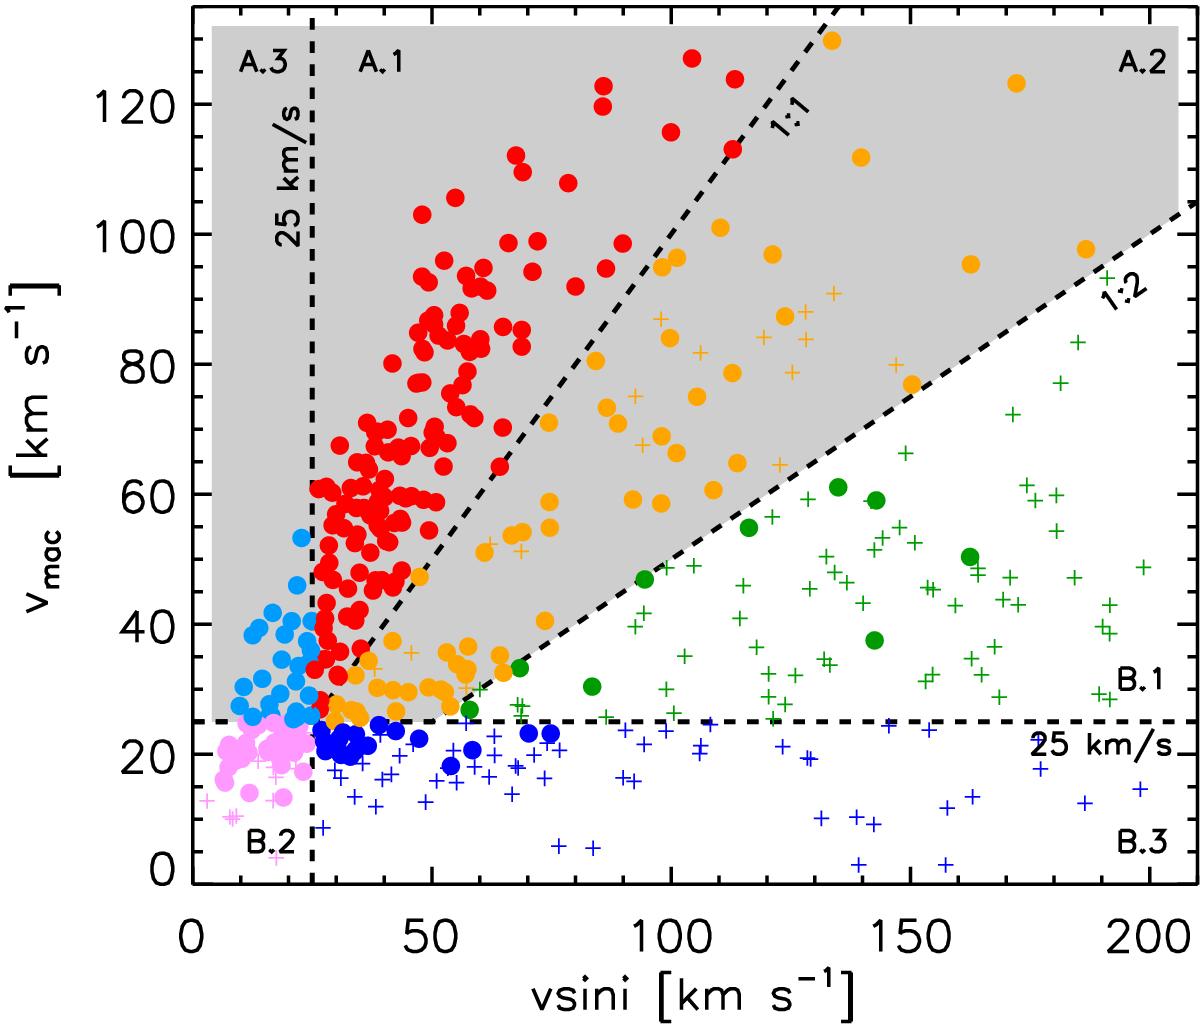
Line-broadening characterization via ν sin i and νmac of a sample of 430 Galactic O and B stars. Crosses correspond to stars for which only an upper limit in νmac could be determined. Various colors and lines separate stars affected by a different relative rotational and macroturbulent broadening contribution. The 25 km s-1 horizontal and vertical lines indicate conservative limitations of the performed methodology (see main text for explanation). Gray-shadowed region groups stars with an important macroturbulent (compared to rotational) broadening contribution.
Current usage metrics show cumulative count of Article Views (full-text article views including HTML views, PDF and ePub downloads, according to the available data) and Abstracts Views on Vision4Press platform.
Data correspond to usage on the plateform after 2015. The current usage metrics is available 48-96 hours after online publication and is updated daily on week days.
Initial download of the metrics may take a while.