Fig. 2
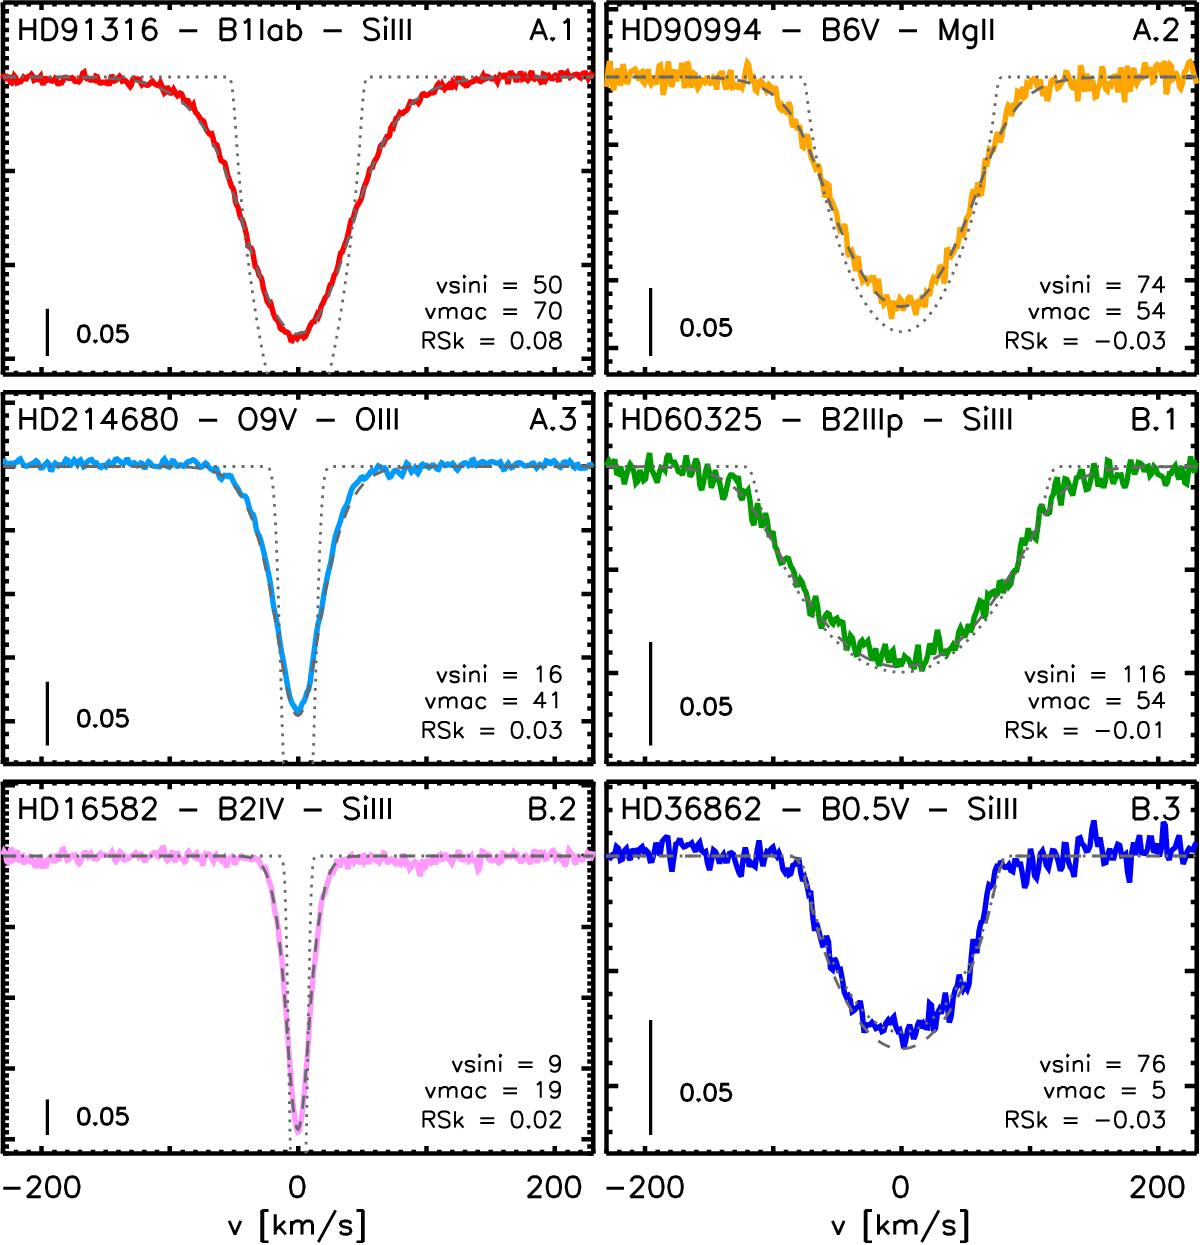
Illustrative examples of the various types of line profiles found in the IACOB sample of O- and B-type stars. The values of ν sin i and νmac resulting from the line-broadening and line-asymmetry analyses (see Sect. 3) are quoted in the lower right corners. Each profile was selected to be a representative of the six regions indicated in Fig. 4 (the same color and A)−B) label codes are used here). The profiles are organized from bottom to top and from left to right, following an increasing sequence of νmac and ν sin i, respectively.
Current usage metrics show cumulative count of Article Views (full-text article views including HTML views, PDF and ePub downloads, according to the available data) and Abstracts Views on Vision4Press platform.
Data correspond to usage on the plateform after 2015. The current usage metrics is available 48-96 hours after online publication and is updated daily on week days.
Initial download of the metrics may take a while.