Fig. 11
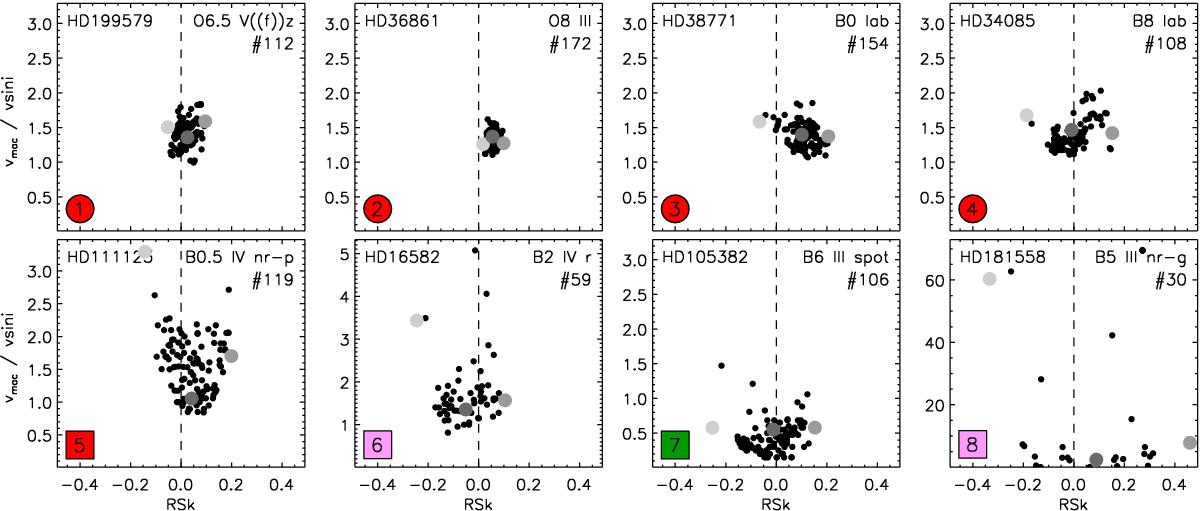
Distribution of points in the RSk – ν sin i/νmac diagram resulting from the line-broadening and line-asymmetry analyses of the full time series for the sample of stars quoted in Table 3. The three gray circles highlighted in each panel correspond to the line profiles shown in Fig. 10 (i.e., those profiles per target having minimum, maximum and close to the mean values of the quantity RSk). We note the different scale in the y-axis in each panel.
Current usage metrics show cumulative count of Article Views (full-text article views including HTML views, PDF and ePub downloads, according to the available data) and Abstracts Views on Vision4Press platform.
Data correspond to usage on the plateform after 2015. The current usage metrics is available 48-96 hours after online publication and is updated daily on week days.
Initial download of the metrics may take a while.