Fig. 10
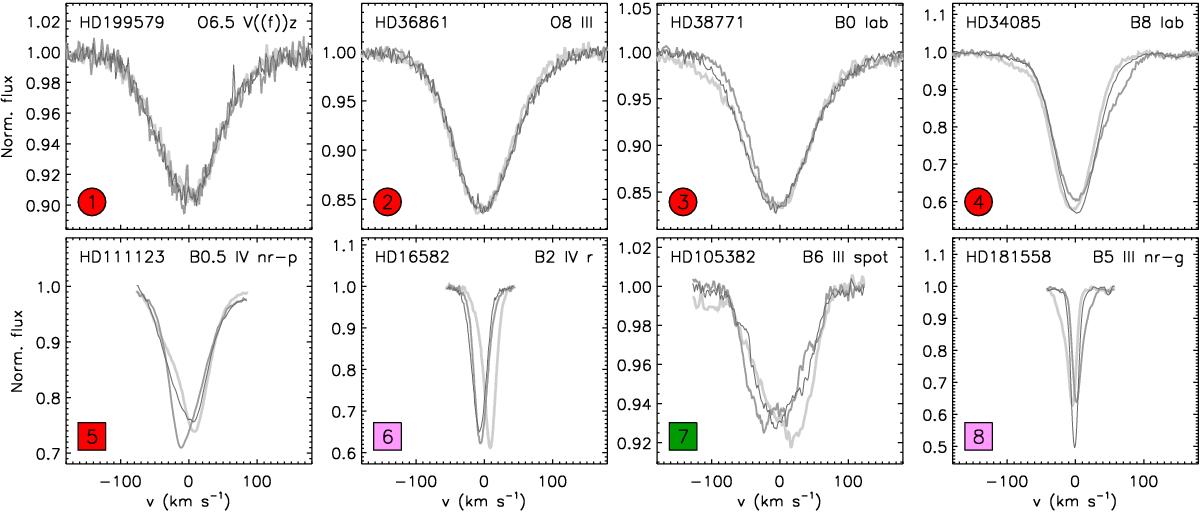
Examples of line-profile shape and variability for the sample of stars quoted in Table 3 and discussed in Sect. 4. The three profiles shown in each panel correspond to different epochs in which the line-asymmetry analysis has resulted in the maximum, minimum, and mean values of RSk, respectively, as derived from the whole time series (see gray filled circles in Fig. 11). Note: HD 199579 and HD 111123 are two single line spectroscopic binaries; in both cases the line-profiles have been shifted in radial velocity to account for the orbital motion of the stars.
Current usage metrics show cumulative count of Article Views (full-text article views including HTML views, PDF and ePub downloads, according to the available data) and Abstracts Views on Vision4Press platform.
Data correspond to usage on the plateform after 2015. The current usage metrics is available 48-96 hours after online publication and is updated daily on week days.
Initial download of the metrics may take a while.