| Issue |
A&A
Volume 597, January 2017
|
|
|---|---|---|
| Article Number | A56 | |
| Number of page(s) | 5 | |
| Section | Planets and planetary systems | |
| DOI | https://doi.org/10.1051/0004-6361/201628445 | |
| Published online | 22 December 2016 | |
Production of O2 through dismutation of H2O2 during water ice desorption: a key to understanding comet O2 abundances
1 LERMA, Université de Cergy Pontoise, Sorbonne Universités, UPMC Univ. Paris 6, PSL Research University, Observatoire de Paris, UMR 8112 CNRS, 5 mail Gay Lussac, 95000 Cergy Pontoise, France
e-mail: This email address is being protected from spambots. You need JavaScript enabled to view it.
2 LESIA, Observatoire de Paris, PSL Research University, CNRS, Sorbonne Universités, UPMC Univ. Paris 06, Univ. Paris-Diderot, Sorbonne Paris Cité, 5 place Jules Janssen, 92195 Meudon, France
Received: 7 March 2016
Accepted: 11 August 2016
Abstract
Context. Detection of molecular oxygen and prediction of its abundance have long been a challenge for astronomers. The low abundances observed in few interstellar sources are well above the predictions of current astrochemical models. During the Rosetta mission, an unexpectedly high abundance of O2 was discovered in the comet 67P/Churyumov-Gerasimenko’s coma. A strong correlation between O2 and H2O productions is observed, whereas no such correlation is observed between O2 and either of CO or N2.
Aims. We suggest that the O2 molecule may be formed during the evaporation of water ice. We propose a possible reaction: the dismutation of H2O2 (2 H2O2−→ 2 H2O + O2), a molecule which should be co-produced during the water ice mantle growth on dust grains. We aim to test this hypothesis under realistic experimental conditions.
Methods. We performed two sets of experiments. They consist of producing a mixture of D2O and D2O2 via the reaction of O2 and D on a surface held at 10 K. The first set is made on a silicate substrate, and explores the limit of thin films, in order to prevent any complication due to trapping during the desorption. The second set is performed on a pre-deposited H2O ice substrate and mimics the desorption of mixed ice.
Results. In thin films, O2 is produced by the dismutation of H2O2, even at temperatures as low as 155 K. Mixed with water, H2O2 desorbs after the water ice sublimation and even more desorption of O2 is observed.
Conclusions. H2O2, synthesised during the growth of interstellar ices (or by later processing), desorbs at the latest stage of the water sublimation and undergoes the dismutation reaction. Therefore an O2 release in the gas phase should occur at the end of the evaporation of ice mantles. Temperature gradients along the geometry of clouds, or interior of comets, should blend the different stages of the sublimation. Averaged along the whole process, a mean value of the O2/H2O ratio of a few percent in the gas phase seems plausible.
Key words: astrochemistry / methods: laboratory: molecular / comets: general
Present address: Aix Marseille Université, CNRS, PIIM UMR 7345, 13397 Marseille; Centrale Marseille, Institut Fresnel UMR 7249, 13013 Marseille, France.
© ESO, 2016
1. Introduction
The recent in-situ measurements of the Rosetta Orbiter Spectrometer for Ion and Neutral Analysis (ROSINA) mass spectrometer onboard Rosetta have unveiled very large O2/H2O ratios in the coma of comet 67P/Churyumov-Gerasimenko (Bieler et al. 2015). Values fluctuate in time and range from 1% to 10%, with an average at 3.8 ± 0.8%. Rubin et al. (2015) determined a value of 3.7 ± 1.7% for comet 1P/Halley, from a reanalysis of measurements performed with the Neutral Mass Spectrometer onboard Giotto. Therefore O2 seems to be a common component outgassing from comets.
These results contrast with the very low level of O2 previously measured in the interstellar medium (ISM; Larsson et al. 2007; Goldsmith et al. 2011; Liseau et al. 2012; Yildiz et al. 2013), and with the low upper limit observed in other galaxies (Kanekar & Meier 2015). The different media show an O2 abundance generally lower than that predicted by models, even if significant progress in modelling has been made (Hincelin et al. 2011; Melnick & Kaufman 2015). Abundances of O2 are also very low in planetary atmospheres (Hall et al. 1995; Johnson et al. 2006), although physical conditions and processes at play are very different from those in comet nuclei.
For comets and in some of interstellar regions the link of the O2 molecule with water desorption is well established (Goldsmith et al. 2011). However, N2 and CO behave differently from O2. A strong correlation between O2 and H2O number densities was observed in 67P’s coma, whereas CO and N2 show much less of a correlation with O2 due to significant production from poorly illuminated regions (Bieler et al. 2015; Rubin et al. 2015). The binding energies of CO (volatile) and H2O are very different, and the absence of correlation between these two molecules is an unsurprising consequence of the different sublimation rates.
However, from an experimental point of view, O2 and CO (or N2) present similar desorption properties, including their trapping in pores of ice (Collings et al. 2004). Although Noble et al. (2015) have shown that they compete during the desorption phase, CO and O2 initially mixed in water should have globally the same desorption behaviour, and therefore the same correlation with water. This is, however, not what is observed. Despite some trapping capability of porous ices, the desorption of most volatile species can happen prior to the ice desorption. This can be observed in experiments in which a low heating rate allowing an efficient diffusion of species into the ice is used (Noble et al. 2012). Therefore O2, N2, and CO productions, led by their thermal history, should be correlated if they were present initially in the comets ice.
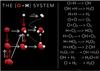 |
Fig. 1 H2O formation network in the solid phase. Red arrows: O addition. White arrows: H addition. Solid arrows: no (or not measurable) barrier to reaction. Dotted arrows: barrier to reaction. See also Lamberts et al. (2014). |
Oxygen and hydrogen are the most abundant reactive elements, and their chemistry generates the most abundant molecules in the Universe, both in the gas phase (H2), and in the solid phase (H2O). These two molecules are thought to be catalyzed by the surface of cold (10−100 K) dust grains composed of silicates or carbonaceous materials. Recently, laboratory experiments have demonstrated that water is easily formed from O atoms (Dulieu et al. 2010; Jing et al. 2011), but also from O2 (Oba et al. 2009; Ioppolo et al. 2010; Chaabouni et al. 2012) or even O3 molecules (Mokrane et al. 2009; Romanzin et al. 2011) by addition of H atoms. The presence of O, O2 and O3 at observable abundances on the surface of grains during ice growth is unlikely because of their high reactivity. Due to hydrogenation one expects an efficient transformation to H2O. Water can also be produced by the reaction of H2 and OH (Oba et al. 2012). The network of solid-state reactions of water is displayed in Fig. 1. Water is easily formed in many ways, and since it is the most stable (i.e. non reactive) species, it is the natural endpoint of the O and H chemistry. However, we notice that especially when starting from O2 molecules, direct addition of two H atoms may lead to the formation of hydrogen peroxide. The molecule H2O2 is even the most abundant to be formed in the case of pre-deposited multilayers of O2 followed by H exposure (Miyauchi et al. 2008; Ioppolo et al. 2008). Once formed, H2O2 molecules can slowly evolve towards water, but the H2O2+H reaction has an activation barrier, and must proceed via quantum tunneling (Oba et al. 2014). It is unlikely that we find O2 mixed in the ice mantles because of its reactivity. In contrast, its main products H2O or H2O2 are very abundant in ice mantles and their ratio (H2O2/H2O) is determined by the degree of hydrogenation, or more exactly by the surface H/O ratio during their formation. H2O2 can also be formed from energetic post processing of H2O (Westley et al. 1995), although the ratio H2O/H2O2 is an equilibrium depending on the irradiation conditions (Loeffler et al. 2006). Observational constraints put the upper limit of the H2O2/H2O ratio to be around 10% (Smith et al. 2011) in ice mantles.
In this paper we investigate the possibility of the O2 molecule being produced during the desorption phase (i.e. the sublimation) of the water. This could happen because of either the dismutation or disproportionation of H2O2. Disproportionation/dismutation is a specific type of redox reaction in which a species is simultaneously reduced and oxidised to form two different products. In our context it is the following reaction:  (1)However, even though this reaction is well known at room temperature, or even bio-catalysed, it has yet to be tested in conditions relevant to astrophysical environments. Once the efficiency of this reaction is shown, we will discuss if this process can explain the large O2/H2O ratio observed in the coma of comet 67P/Churyumov-Gerasimenko.
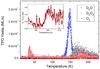 |
Fig. 2 TPD of 1 ML O2 reacting with 6 ML of D atoms, on a silicate substrate held at 10 K. Red squares: O2 signal; blue circles: D2O signal; black triangles: D2O2 signal. Inset: O2/D2O2 ratio. |
2. Experiments
The experiments were performed using the FORMOLISM set-up (Congiu et al. 2012). It is composed of a main UHV chamber, in which a temperature-controlled (6−400 K) sample holder is located. One atomic D beam and one O2 beam are aimed at the sample made of amorphous silicates for the first set of experiments. This sample was obtained by thermal evaporation of San Carlos olivine (Mg1.8Fe0.2SiO4) onto a gold-coated substrate (1 cm in diameter). The surface density of adsorption sites is about the same as that found on compact ice samples (Noble et al. 2012). Sample preparation and surface analysis are described extensively in Djouadi et al. (2005).
For the second set of experiments, the substrate is covered with an amorphous solid water ice (ASW) mantle with a thickness of about 25 monolayers. One monolayer (ML) corresponds to 1015 mol/cm2. This ASW is compact because it has been formed at 110 K, before being cooled to 10 K, the temperature where both O2 and D are deposited. We use a D beam in order to distinguish the D2O and D2O2 formed by beam deposition from constituents of the substrate made of H2O. Details of procedures can be found in Chaabouni et al. (2012).
Figure 2 shows the thermally programmed desorption (TPD) of products made after exposure of 1 ML of O2 with 6 ML of D atoms, sent on the silicate substrate held at 10 K. This proportion of reactants has been chosen to maximise the D2O2 production, which in this case leads to similar abundances of D2O and D2O2. The TPD technique consists of increasing the temperature of the substrate linearly, and monitoring the desorption profile of all products with a quadrupole mass spectrometer located in front of the sample. The heating ramp is 10 K per minute. The desorption of O2 occurs in two steps. The first one, at around 40 K, is the O2 thermal desorption peak (unreacted O2 molecules). The second step of O2 desorption appears after the surface temperature has reached 175 K. This part of the signal is not due to any contamination or cracking pattern, but is the demonstration that O2 is produced on the surface at this temperature. The water formed (D2O) is desorbing at around 150 K, and but no codesorption of O2 is observed. The codesorption could have originated from the O2 present at 10 K and trapped by water, then freed during its desorption. The absence of codesorption demonstrates that the trapping mechanism is inefficient for such thin ices (less than a layer of D2O+D2O2 formed). Furthermore there is a desorption tail of D2O at temperatures higher than 150 K which is not present if the same amount of D2O is simply deposited (and not formed). This signal is also due to the transformation of a product of the O2+D reaction, which occurs at high temperatures. D2O2 desorption starts once all the water has desorbed, because of its higher binding energy (Loeffler & Baragiola 2011) to the silicate substrate. The D2O/D2O2 ratio is close to unity in the 180−210 K region. The inset in Fig. 2 shows that above 180 K O2/D2O2 is rather constant with a mean value of 0.4. This is close to half of the D2O/D2O2 ratio, taking into account the error bars.
We interpret the second desorption peaks of O2 and D2O in the temperature region of the D2O2 desorption as the signature of the dismutation of water peroxide into water and molecular oxygen. The stoichiometry (2 H2O for 1 O2) is also respected. The dismutation of water peroxide is a well known process occurring during the evaporation of H2O2 under atmospheric conditions or on metallic surfaces (Giguère & Secco 1954). Our experiment shows that the dismutation can be efficient even at the temperature of ice sublimation under vacuum. Moreover, we point out that the dismutation rate is comparable with the desorption rate. We note that the dismutation efficiency increases with the temperature especially between 155 and 180 K, before being stable. In these late conditions of desorption, the D2O2 dismutation is as probable as the desorption, in our sub-monolayers conditions.
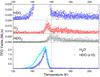 |
Fig. 3 TPD of 4 ML O2 reacting with 6 ML of D atoms, on a silicate substrate held at 10 K pre-covered with 25 ML of ASW. Top panel: HDO (blue circles), O2 (red squares), and HDO2 (black triangles). HDO and O2 curves are offset for clarity. Bottom panel: HDO (blue circles) and H2O (cyan circles) TPD signals. The HDO signal has been rescaled, in order to make the dynamics apparent. |
The second set of experiments was performed on a pre-deposited H2O compact ASW of 25 ML of thickness. Therefore, we expect a H2O/D2O2 ratio of about 5% at the end of the exposure of reactants. This is more representative of the water formed in the ISM, although the results may become harder to interpret. Thanks to the use of D, it is possible to disentangle between the molecules originating from the substrate and the molecules formed. Before the desorption phase, proton exchange is taking place (Scott Smith et al. 1997). Therefore, D2O2 is mainly detected as HDO2, and D2O is also detected as HDO. For sake of simplicity, we give no further details of how we treat the proton exchange in this article.
Figure 3 shows the desorption of mass 32 (O2). Here again, there is an initial desorption at about 40 K (not represented), but no codesorption between 130 and 150 K, and no volcano effect at the crystallization point at 145 K. This is due to the fact that the substrate is compact and therefore the trapping mechanism is very reduced. However, there is a sudden release of O2 at 155 K, exactly when the water signal is starting to decrease. For multilayer samples, the decrease of TPD signals is due to the reduction of the surface density of adsorbates; in other words, it happens when the desorbing ice is thinner than a single layer. So the 155 K desorption of O2 is due to O2 locked (or formed) below the H2O ice. The sudden release of O2 at 155 K is not accompanied by a D2O2 signal, but is coincident with a high desorption rate of D2O which corresponds to just over twice the O2 rate. Here again the origin of O2 should be the dismutation reaction, because any trapped O2 should have desorbed earlier during the crystallisation of the water. However, we have to explain why it happens at the very end of the water sublimation, and not before. This is probably due to the fact that the substrate may catalyze the dismutation reaction, or due to the fact that the dismutation reaction requires high concentration of H2O2, both of which happen only when most of the water has left the surface.
The late desorption signal (above 160 K) of H2O, O2 and D2O2 is similar to that observed in a thin layer, except for the H/D composition. Both HDO, O2 and HDO2 are codesorbing with the same ratios as in the previous experiment. The absence of D2O signal at temperatures higher than 160 K, is due to the prior proton exchange. A desorption tail of mass 19 (HDO) is observed instead between 160 and 200 K very similarly to the desorption of mass 20 (D2O) obtained in experiments made directly on silicates (Fig. 2), because there is no proton scrambling with the substrate in this case.
In the first set of experiments, the dismutation efficiency is about 50%, whereas in the second experiment it is close to unity at 155 K, the end of water sublimation.
3. Discussion
In astrophysical environments solid H2O and H2O2 are correlated. In Mars’ atmosphere, models including heterogeneous catalysis better reproduce the observed abundance ratios (Encrenaz et al. 2015). In the ISM, because of their common formation pathways on dust grains, H2O and H2O2 are believed to have a common chemical origin. In most of the current astrochemical models (Tielens & Hagen 1982; Taquet et al. 2012; Du et al. 2012), a value of a few percent for the H2O2/H2O ratio is calculated. This is in line with the upper values of 9 ± 4% observed in interstellar ices by Smith et al. (2011).
Though less obvious, the link between O2 and H2O2 in ISM has also been established by Parise et al. (2014). Both O2 and H2O2 are overestimated in models and are very elusive to observers, except for the ρ Ophiuchus A core. In this region, dust grains are warm enough to desorb water ice and thus keep a significant fraction of elemental oxygen in the gas phase, with a significant fraction as O2 as stated by Goldsmith et al. (2011). ρ Oph A is also the only region where positive detection of H2O2 has been done (Bergman et al. 2011). Coincidence or not, the measured O2/H2O2 ratios are identical in the ISM and in the coma of 67P/Churyumov-Gerasimenko. The H2O2/O2 ratio is rather low in both cases, with a relative value of 6 × 10⁻⁴ (Bergman et al. 2011; Bieler et al. 2015).
Our second experiment clearly demonstrates that the desorption of a mixture of H2O2/H2O at a relative concentration of about 5% is able to produce O2 and its sudden release into the gas phase at the end of the water desorption. A reasonable initial concentration of H2O2 of 7% would give the 3.5% of O2 detected in the comet. However, if the link between O2, H2O and H2O2 seems established by our experiments and corroborates the role of the water desorption in the observation of O2, the ratio H2O2/O2 of 6 × 10⁻⁴ observed in astrophysical media is clearly not matched in our experiments. To achieve such a ratio, the dismutation reaction should be almost complete. In our experiments, efficiency is about 50% for thin films, although the reaction can almost be complete at the very end of water desorption. Loeffler & Baragiola (2011) have studied the isothermal desorption of H2O2/H2O mixtures and have demonstrated that the phase separation is obtained at 151.6 K. As a consequence, in our experiments the transportation of D2O2 (initially on the top of the 25 layers of H2O) through the ASW film during the desorption must take place. Moreover the dissociation of the D2O2:H2O complex should favour a sudden increase of the D2O2 concentration close to the sample surface and therefore enhances the dismutation reaction. This is one of the possible explanations for the O2 and D2O burst at 155 K, the end of the water desorption.
In our experiments, H2O2 has two possible evolutions: either it desorbs or it reacts. Obviously, the longer molecules stay on the surface, the higher the temperature increase and therefore, the higher their probability of reacting. In the experiments on silicates, the H2O2 desorption is not delayed due to the absence of any H2O ice cap, and as a consequence the desorption route is maximised and the reaction one minimised. In other words, thin film condition reduces the dismutation reaction efficiency; our experiments correspond to the lower limit of its efficiency (few tens of percent).
Thicker ice layers need more time to sublimate and this increases the interaction time of H2O2 with itself. If the temperature is increasing (like in our experiments) the desorption temperature is also increased, and therefore the reaction can proceed at higher temperatures. We note that the free desorption of H2O2 begins at about 150 K in the first set of experiments, but only at about 155 K in the second set of experiments. The excess O2 signal can be enhanced by this delayed desorption. At higher temperatures (>180 K, inset of Fig. 2), the dismutation is favoured, even if the concentration of H2O2 is low because of its previous partial desorption. Therefore any effect that would increase the H2O2 interaction time, or the H2O2 sublimation temperature (such as a delay by a thick cap of ice) will favour the dismutation reaction. Cometary ices are believed to be of very large thickness. Brown et al. (2012) were able to perform their experiments at 207 K by using a meter sized sample and mimicking water sublimation of comets. Even if the detail is beyond the scope of this paper, we add that the total efficiency of two competing mechanisms such as reaction and desorption, both of which follow Arrhenius’s laws are very dependent on the heating rate. A fast heating (as in our experiments 10 K/min) favours desorption, whereas a very slow heating (ISM < K/century, 67P comet < 0.2 K/min) favours the diffusion, and therefore enhances the reactivity.
Even if the hypothesis of a possible complete dismutation of H2O2 has still to be explicitly demonstrated by a more complete set of experimental investigations, a transposition to more astrophysically relevant conditions, such as lower heating rate and thicker ice layers would increase our measured high efficiency.
Furthermore our experiments clearly show that some reactions can proceed during the water ice sublimation. Other reactions could also be precursors of molecular oxygen. For example, OH+OH has many possible chemical ends, like O2+H2 or H2O+O. The molecules O2H+OH probably react in O2+H2O. Therefore, any trapped OxHy molecules in water ice, originating from the non total hydrogenation during the water mantle growth, or by later energetic processing (i.e. UV photons, ions ...), have a chance to react during the duration of the desorption of the water. The role of water bulk in reactions between complex molecules is now commonly accepted (Fresneau et al. 2014), even if reactions usually take place before water desorption. As far as the composition of the ice components is a pure dark cloud chemistry (with low UV and few energetic processes), the slow building of the ice should keep the number of such reactive (i.e. OxHy) molecules relatively low. The observed ice composition does not reveal large reservoir of such candidate (<1% of H2O). Therefore the contribution of these other molecules to the production of O2 should complement the H2O2 dismutation but should contribute less.
Comets and asteroids undergo solar winds and light. High energy particles change the chemical composition of the ice, and therefore radicals can be implanted later in ice. But here again, because the major compound of ice is water, the concentration of radicals cannot reasonably be in excess of a few percent of the ice composition. In their paper about ion implantation in water ice, Gomis et al. (2004a,b) have observed hydrogen peroxyde production. The H2O2 formation rapidly reached the equilibrium between formation and destruction at a value of about 1 to 6% of the water matrix. Here we note that if water has been processed by solar winds in its solid phase before its desorption in the atmosphere of the comet, the H2O2 abundance should be in this 1−6% with respect to the H2O range. The dismutation of H2O2 during ice desorption would also help to understand the low abundance of H2O2 measured in the comet atmosphere.
Our experiments follow very simply and chronologically a linear temperature ramp. This is not similar to conditions of water sublimation in astrophysical environments. On the surface and in the depth of cometary nuclei, there are huge gradients of temperature, and the desorption of water or other molecules is spatially inhomogeneous and subject to diurnal variation (e.g. Bockelée-Morvan et al. 2015; Lee et al. 2015; Le Roy et al. 2015; Migliorini et al. 2016). Topological and geological diversity makes a comet a very rich but inhomogeneous medium. Furthermore volatile materials can come from below a large cover of dust, and have the possibility to freeze again on the external surface during the comet’s night (De Sanctis et al. 2015).
 |
Fig. 4 Simplified schematic view of the gradient of temperature due to the inhomogeneous and time dependent solar illumination. Illustration of the spatially differenced origin of the desorbing molecules. |
In order to directly apply desorption experiments to comets, we should sum up experiments at all stages of their thermal regimes. Cold deep parts of the comets would correspond to desorption of high volatility molecules (CO, N2), higher temperature regions would correspond to water desorption, with O2 release due to H2O2 dismutation occurring at the end of water desorption. Figure 4 illustrates this simple picture of the differentiated origins of molecules desorbing from a comet. Thus, depending on the extension of the water sublimation region, both H2O and O2 should be correlated. However, because of their very different temperature of desorption regime, and so because of their different geographical origin, CO and N2 should follow another time dependency.
4. Conclusion
Both in ISM and in comets, the presence of the elusive O2 molecule seems to be linked to H2O sublimation. During its formation in prestellar cores, water ice can be incompletely hydrogenated and a fraction of water peroxide, as high as 7%, can be incorporated in the ice mantle. After a long journey, water ice can sublimate from a comet, or from some specific illuminated cores such as ρ Oph A, and its water peroxide component may self-react, being transformed into water and O2, provoking an apparent coincidence of molecular oxygen and water vapor. Our experiments show that the dismutation of H2O2 before its desorption can be efficient even at very low temperature, although more investigations should be done to demonstrate that it can be complete, to match the observational high ratio of molecular oxygen versus water peroxide.
Acknowledgments
This work was supported by the CNRS program Physique et Chimie du Milieu Interstellaire (PCMI), and the Program DIM-ACAV of the region Ile de France.
References
- Bergman, P., Parise, B., Liseau, R., et al. 2011, A&A, 531, L8 [NASA ADS] [CrossRef] [EDP Sciences] [Google Scholar]
- Bieler, A., Altwegg, K., Balsiger, H., et al. 2015, Nature, 526, 678 [Google Scholar]
- Bockelée-Morvan, D., Debout, V., Erard, S., et al. 2015, A&A, 583, A6 [NASA ADS] [CrossRef] [EDP Sciences] [Google Scholar]
- Brown, R. H., Lauretta, D. S., Schmidt, B., & Moores, J. 2012, Planet. Space Sci., 60, 166 [NASA ADS] [CrossRef] [Google Scholar]
- Chaabouni, H., Minissale, M., Manicò, G., et al. 2012, J. Chem. Phys., 137, 234706 [NASA ADS] [CrossRef] [PubMed] [Google Scholar]
- Collings, M. P., Anderson, M. A., Chen, R., et al. 2004, MNRAS, 354, 1133 [NASA ADS] [CrossRef] [Google Scholar]
- Congiu, E., Chaabouni, H., Laffon, C., et al. 2012, J. Chem. Phys., 137, 054713 [NASA ADS] [CrossRef] [Google Scholar]
- De Sanctis, M., Capaccioni, F., Ciarniello, M., et al. 2015, Nature, 525, 500 [NASA ADS] [CrossRef] [Google Scholar]
- Djouadi, Z., D’Hendecourt, L., Leroux, H., et al. 2005, A&A, 440, 179 [NASA ADS] [CrossRef] [EDP Sciences] [Google Scholar]
- Du, F., Parise, B., & Bergman, P. 2012, A&A, 538, A91 [NASA ADS] [CrossRef] [EDP Sciences] [Google Scholar]
- Dulieu, F., Amiaud, L., Congiu, E., et al. 2010, A&A, 512, A30 [NASA ADS] [CrossRef] [EDP Sciences] [Google Scholar]
- Encrenaz, T., Greathouse, T. K., Lefèvre, F., et al. 2015, A&A, 578, A127 [NASA ADS] [CrossRef] [EDP Sciences] [Google Scholar]
- Fresneau, A., Danger, G., Rimola, A., et al. 2014, MNRAS, 443, 2991 [NASA ADS] [CrossRef] [Google Scholar]
- Giguère, P. A., & Secco, E. A. 1954, Can. J. Chem., 32, 550 [CrossRef] [Google Scholar]
- Goldsmith, P. F., Liseau, R., Bell, T. A., et al. 2011, ApJ, 737, 96 [Google Scholar]
- Gomis, O., Leto, G., & Strazzulla, G. 2004a, A&A, 420, 405 [NASA ADS] [CrossRef] [EDP Sciences] [Google Scholar]
- Gomis, O., Satorre, M., Strazzulla, G., & Leto, G. 2004b, Planet. Space Sci., 52, 371 [NASA ADS] [CrossRef] [MathSciNet] [Google Scholar]
- Hall, D. T., Strobel, D. F., Feldman, P. D., McGrath, M. A., & Weaver, H. A. 1995, Nature, 373, 677 [NASA ADS] [CrossRef] [PubMed] [Google Scholar]
- Hincelin, U., Wakelam, V., Hersant, F., et al. 2011, A&A, 530, A61 [NASA ADS] [CrossRef] [EDP Sciences] [Google Scholar]
- Ioppolo, S., Cuppen, H. M., Romanzin, C., van Dishoeck, E. F., & Linnartz, H. 2008, ApJ, 686, 1474 [NASA ADS] [CrossRef] [Google Scholar]
- Ioppolo, S., Cuppen, H. M., Romanzin, C., van Dishoeck, E. F., & Linnartz, H. 2010, Phys. Chem. Chem. Phys., 12, 12065 [NASA ADS] [CrossRef] [Google Scholar]
- Jing, D., He, J., Brucato, J., et al. 2011, ApJ, 741, L9 [NASA ADS] [CrossRef] [Google Scholar]
- Johnson, R., Luhmann, J., Tokar, R., et al. 2006, Icarus, 180, 393 [NASA ADS] [CrossRef] [Google Scholar]
- Kanekar, N., & Meier, D. S. 2015, ApJ, 811, L23 [NASA ADS] [CrossRef] [Google Scholar]
- Lamberts, T., de Vries, X., & Cuppen, H. M. 2014, Faraday Discussion, 168, 327 [NASA ADS] [CrossRef] [Google Scholar]
- Larsson, B., Liseau, R., Pagani, L., et al. 2007, A&A, 466, 999 [Google Scholar]
- Le Roy, L., Altwegg, K., Balsigerand, H., et al. 2015, A&A, 583, A1 [NASA ADS] [CrossRef] [EDP Sciences] [Google Scholar]
- Lee, S., von Allmen, P., Allen, M., et al. 2015, A&A, 583, A5 [NASA ADS] [CrossRef] [EDP Sciences] [Google Scholar]
- Liseau, R., Goldsmith, P. F., Larsson, B., et al. 2012, A&A, 541, A73 [NASA ADS] [CrossRef] [EDP Sciences] [Google Scholar]
- Loeffler, M. J., & Baragiola, R. A. 2011, J. Phys. Chem. A, 115, 5324 [CrossRef] [Google Scholar]
- Loeffler, M. J., Teolis, B. D., & Baragiola, R. A. 2006, J. Chem. Phys., 124, 104702 [NASA ADS] [CrossRef] [Google Scholar]
- Melnick, G. J., & Kaufman, M. J. 2015, ApJ, 806, 227 [NASA ADS] [CrossRef] [Google Scholar]
- Migliorini, A., Piccioni, G., Capaccioni, F., et al. 2016, A&A, 589, A45 [NASA ADS] [CrossRef] [EDP Sciences] [Google Scholar]
- Miyauchi, N., Hidaka, H., Chigai, T., et al. 2008, Chem. Phys. Lett., 456, 27 [NASA ADS] [CrossRef] [Google Scholar]
- Mokrane, H., Chaabouni, H., Accolla, M., et al. 2009, ApJ, 705, L195 [NASA ADS] [CrossRef] [Google Scholar]
- Noble, J. A., Theule, P., Mispelaer, F., et al. 2012, A&A, 543, A5 [NASA ADS] [CrossRef] [EDP Sciences] [Google Scholar]
- Noble, J. A., Diana, S., & Dulieu, F. 2015, MNRAS, 454, 2636 [NASA ADS] [CrossRef] [Google Scholar]
- Oba, Y., Miyauchi, N., Hidaka, H., et al. 2009, ApJ, 701, 464 [NASA ADS] [CrossRef] [Google Scholar]
- Oba, Y., Watanabe, N., Hama, T., et al. 2012, ApJ, 749, 67 [NASA ADS] [CrossRef] [Google Scholar]
- Oba, Y., Osaka, K., Watanabe, N., Chigai, T., & Kouchi, A. 2014, Faraday Discussion, 168, 185 [NASA ADS] [CrossRef] [Google Scholar]
- Parise, B., Bergman, P., & Menten, K. 2014, Faraday Discussion, 168, 349 [NASA ADS] [CrossRef] [Google Scholar]
- Romanzin, C., Ioppolo, S., Cuppen, H. M., van Dishoeck, E. F., & Linnartz, H. 2011, J. Chem. Phys., 134, 084504 [NASA ADS] [CrossRef] [Google Scholar]
- Rubin, M., Altwegg, K., Balsiger, H., et al. 2015, Science, 348, 232 [NASA ADS] [CrossRef] [Google Scholar]
- Scott Smith, R., Huang, C., & Kay, B. D. 1997, J. Chem. Phys. B, 101, 6123 [NASA ADS] [CrossRef] [Google Scholar]
- Smith, R. G., Charnley, S. B., Pendleton, Y. J., et al. 2011, ApJ, 743, 131 [NASA ADS] [CrossRef] [Google Scholar]
- Taquet, V., Ceccarelli, C., & Kahane, C. 2012, A&A, 538, A42 [NASA ADS] [CrossRef] [EDP Sciences] [Google Scholar]
- Tielens, A. G. G. M., & Hagen, W. 1982, A&A, 114, 245 [Google Scholar]
- Westley, M. S., Baragiola, R. A., Johnson, R. E., & Baratta, G. A. 1995, Nature, 373, 405 [NASA ADS] [CrossRef] [PubMed] [Google Scholar]
- Yildiz, U. A., Acharyya, K., Goldsmith, P. F., et al. 2013, A&A, 558, A58 [NASA ADS] [CrossRef] [EDP Sciences] [Google Scholar]
All Figures
|
Fig. 1 H2O formation network in the solid phase. Red arrows: O addition. White arrows: H addition. Solid arrows: no (or not measurable) barrier to reaction. Dotted arrows: barrier to reaction. See also Lamberts et al. (2014). |
| In the text | |
|
Fig. 2 TPD of 1 ML O2 reacting with 6 ML of D atoms, on a silicate substrate held at 10 K. Red squares: O2 signal; blue circles: D2O signal; black triangles: D2O2 signal. Inset: O2/D2O2 ratio. |
| In the text | |
|
Fig. 3 TPD of 4 ML O2 reacting with 6 ML of D atoms, on a silicate substrate held at 10 K pre-covered with 25 ML of ASW. Top panel: HDO (blue circles), O2 (red squares), and HDO2 (black triangles). HDO and O2 curves are offset for clarity. Bottom panel: HDO (blue circles) and H2O (cyan circles) TPD signals. The HDO signal has been rescaled, in order to make the dynamics apparent. |
| In the text | |
|
Fig. 4 Simplified schematic view of the gradient of temperature due to the inhomogeneous and time dependent solar illumination. Illustration of the spatially differenced origin of the desorbing molecules. |
| In the text | |
Current usage metrics show cumulative count of Article Views (full-text article views including HTML views, PDF and ePub downloads, according to the available data) and Abstracts Views on Vision4Press platform.
Data correspond to usage on the plateform after 2015. The current usage metrics is available 48-96 hours after online publication and is updated daily on week days.
Initial download of the metrics may take a while.