Fig. 2
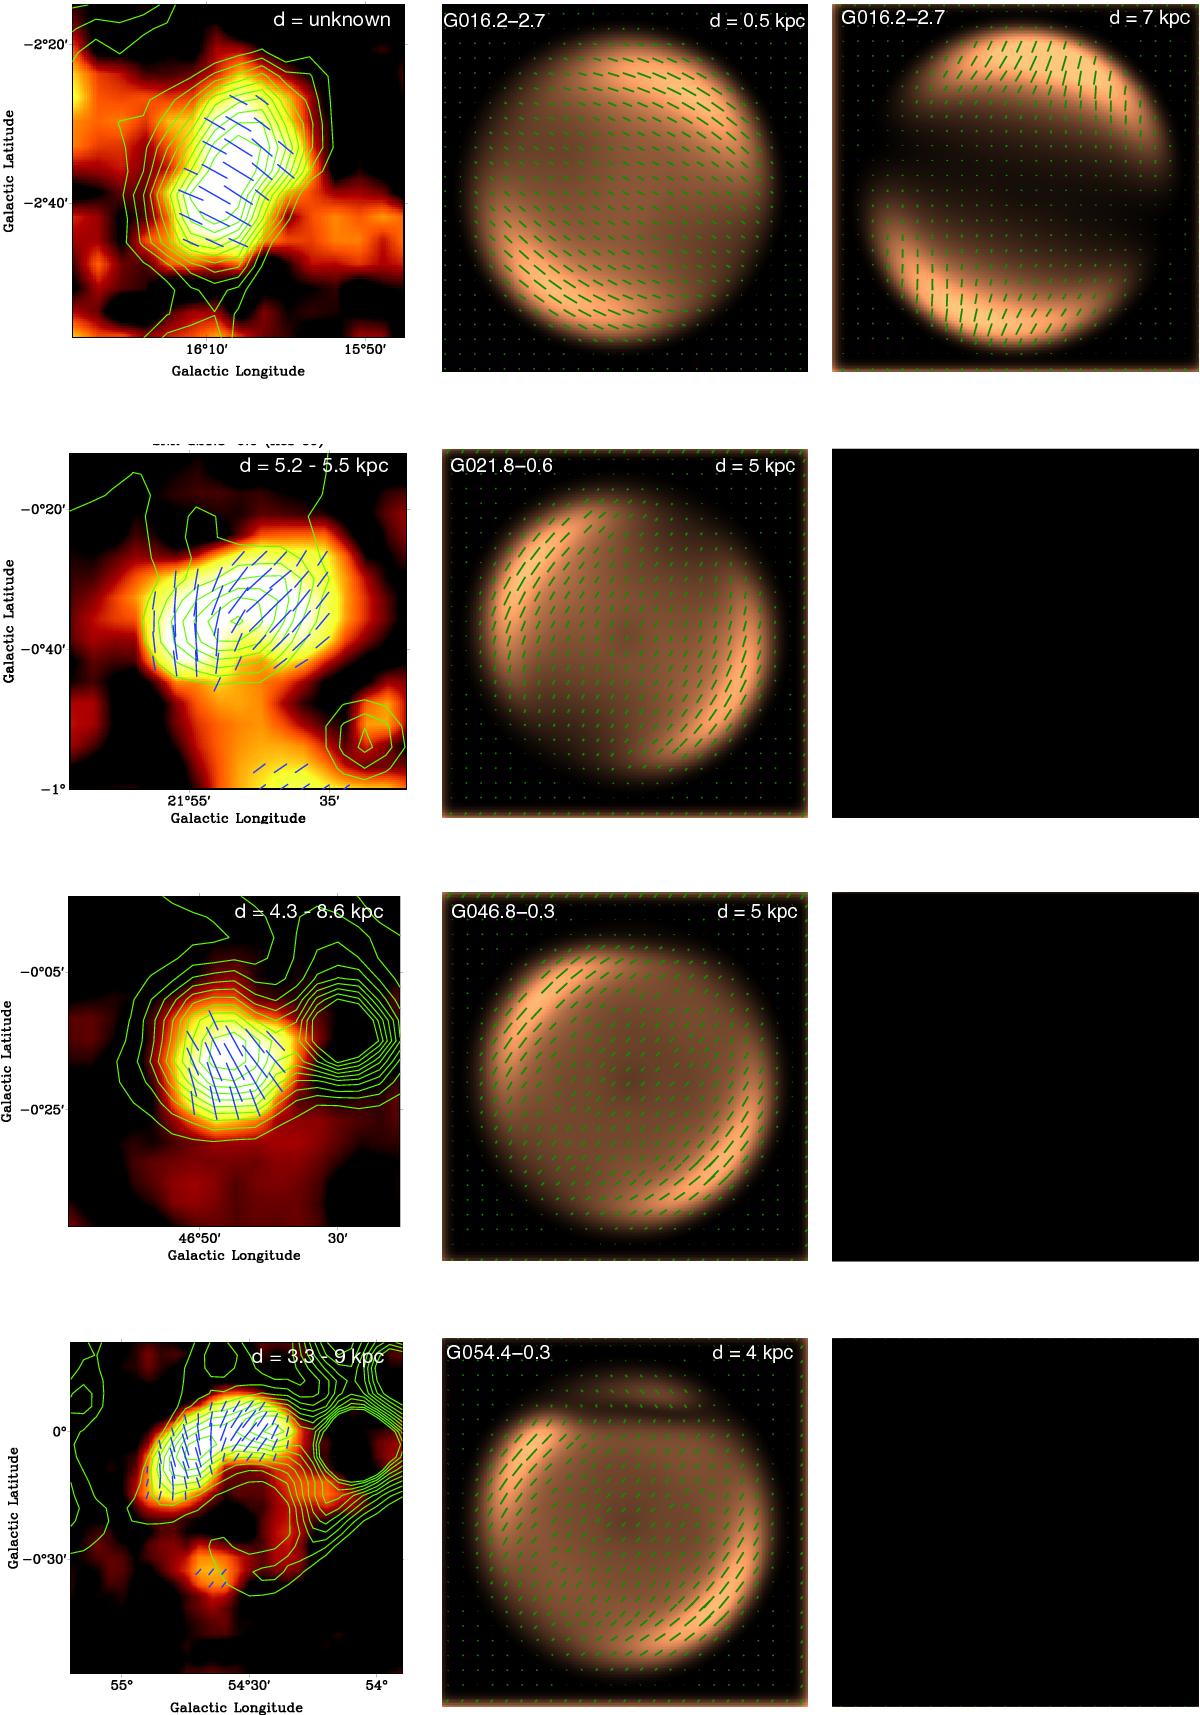
Comparison of the magnetic fields for all cases where a magnetic field has been measured. Magnetic field vectors are plotted on top of the polarized intensity emission. Data (left column) from top to bottom: G016.2–02.7 (Sun et al. 2011a), G021.8–00.6 (Sun et al. 2011a), G046.8–00.3 (Sun et al. 2011a), and G054.4–00.3 (Sun et al. 2011a). Where the data are presented in equatorial coordinates, they are rotated to Galactic coordinates for consistency with the models. Center: best-fit quasi-perpendicular case using the JF12 model. Right: best-fit quasi-parallel case using the JF12 model. In some cases there are no models that match the date reasonably well and the model is shown as blank in these cases.
Current usage metrics show cumulative count of Article Views (full-text article views including HTML views, PDF and ePub downloads, according to the available data) and Abstracts Views on Vision4Press platform.
Data correspond to usage on the plateform after 2015. The current usage metrics is available 48-96 hours after online publication and is updated daily on week days.
Initial download of the metrics may take a while.