Fig. 4
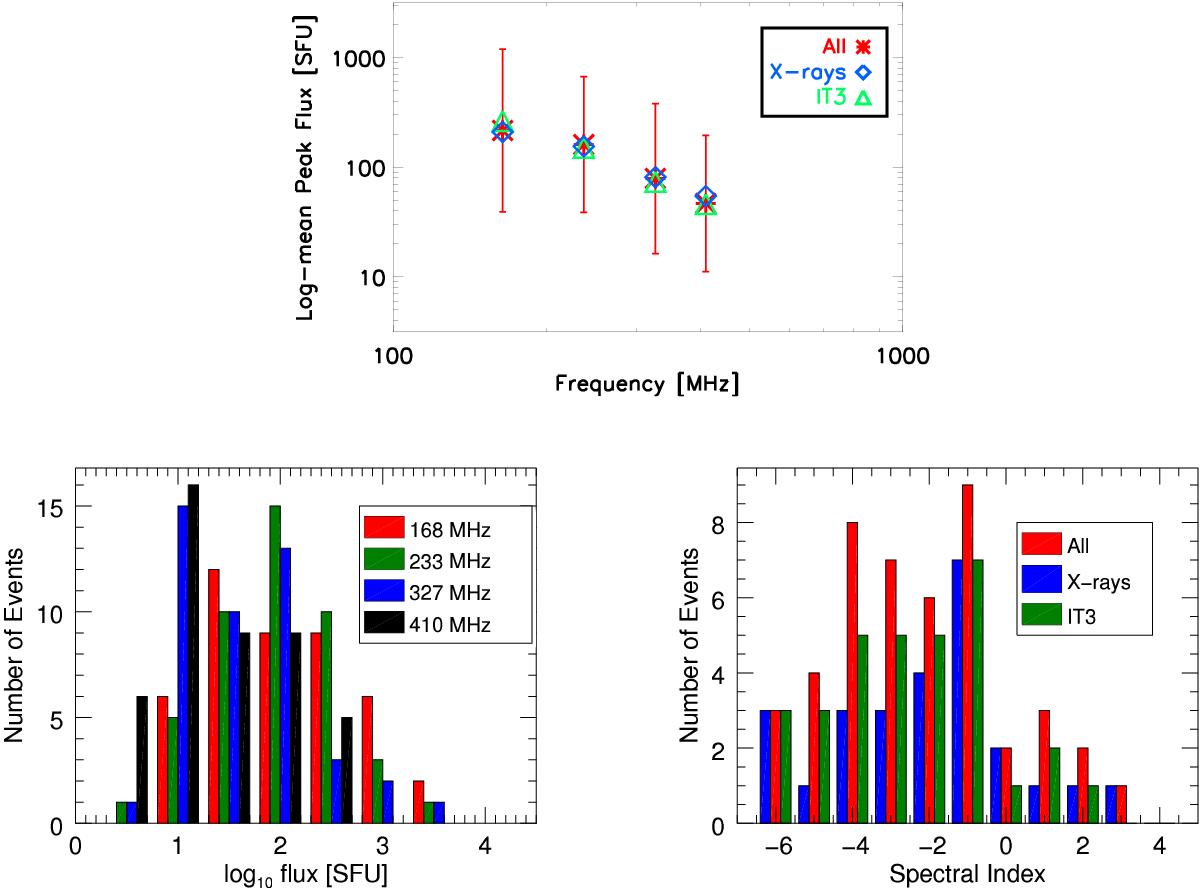
Top: a) log-mean peak flux from the 45 (red) type III events that were observed in all four frequency bands from 164 MHz to 410 MHz, where peaks in X-rays or radio are within 40 s of each other. Errors shown are the standard deviations on the log of the peak fluxes. Also shown are the subset (32, green) that had interplanetary bursts and the subset (26, blue) that had 25–50 keV X-ray emission. Bottom left: b) the distribution of the events as a function of peak flux for the 45 type III bursts. Note the different distributions for each frequency and the large spread in peak flux. Bottom right: c) the distribution of the spectral indices found by fitting a straight line to the peak fluxes for each event. All the events (45, red), the subset (32, green) with interplanetary type IIIs, and the subset (26, blue) with 25–50 keV X-rays are shown.
Current usage metrics show cumulative count of Article Views (full-text article views including HTML views, PDF and ePub downloads, according to the available data) and Abstracts Views on Vision4Press platform.
Data correspond to usage on the plateform after 2015. The current usage metrics is available 48-96 hours after online publication and is updated daily on week days.
Initial download of the metrics may take a while.