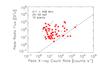
Fig. 3
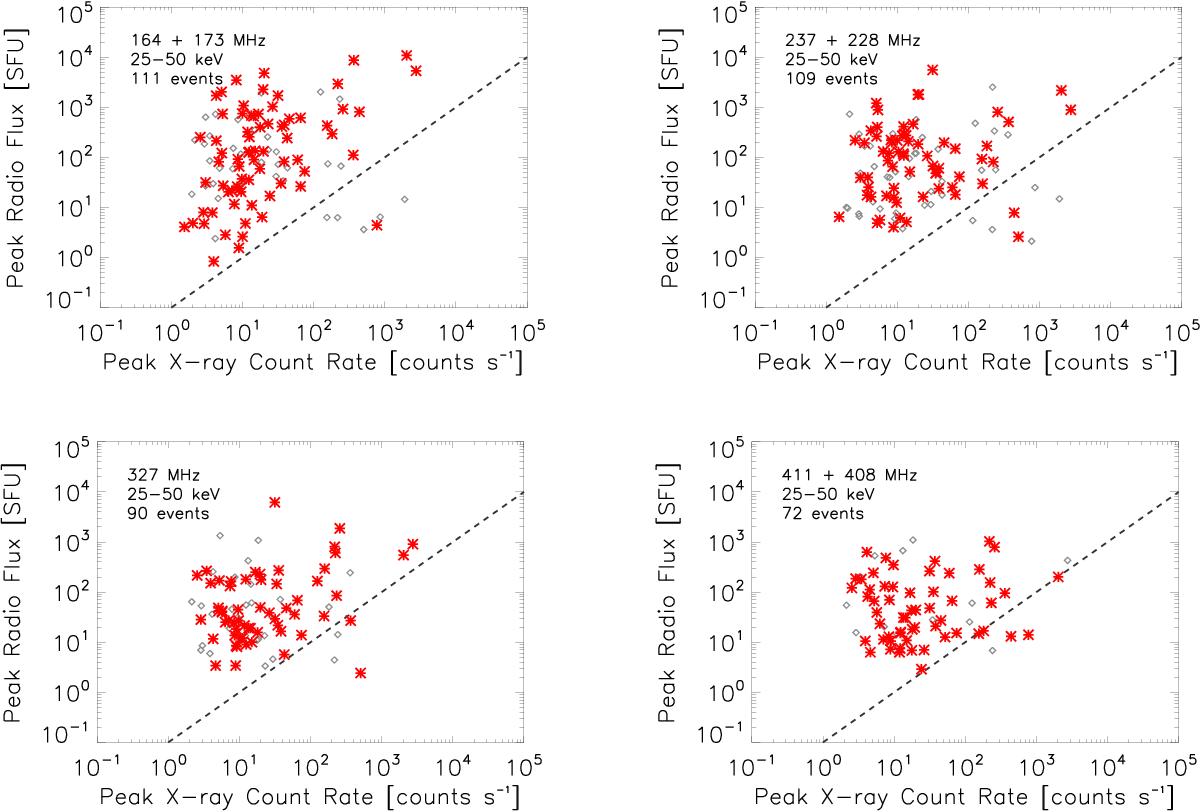
Scatter plot of the peak radio flux in the four frequency ranges vs. the 25–50 keV peak X-ray count rate. The red stars indicate the events where the peak X-ray count rate and peak radio flux are within 40 s of each other. Log-log correlation coefficients of the red stars are 0.09, 0.34, 0.16, 0.46 from around 410 MHz to around 170 MHz respectively. The dashed line at y = 0.1x highlights the general absence of events with high X-ray count rates and low radio flux.
Current usage metrics show cumulative count of Article Views (full-text article views including HTML views, PDF and ePub downloads, according to the available data) and Abstracts Views on Vision4Press platform.
Data correspond to usage on the plateform after 2015. The current usage metrics is available 48-96 hours after online publication and is updated daily on week days.
Initial download of the metrics may take a while.