Fig. 1
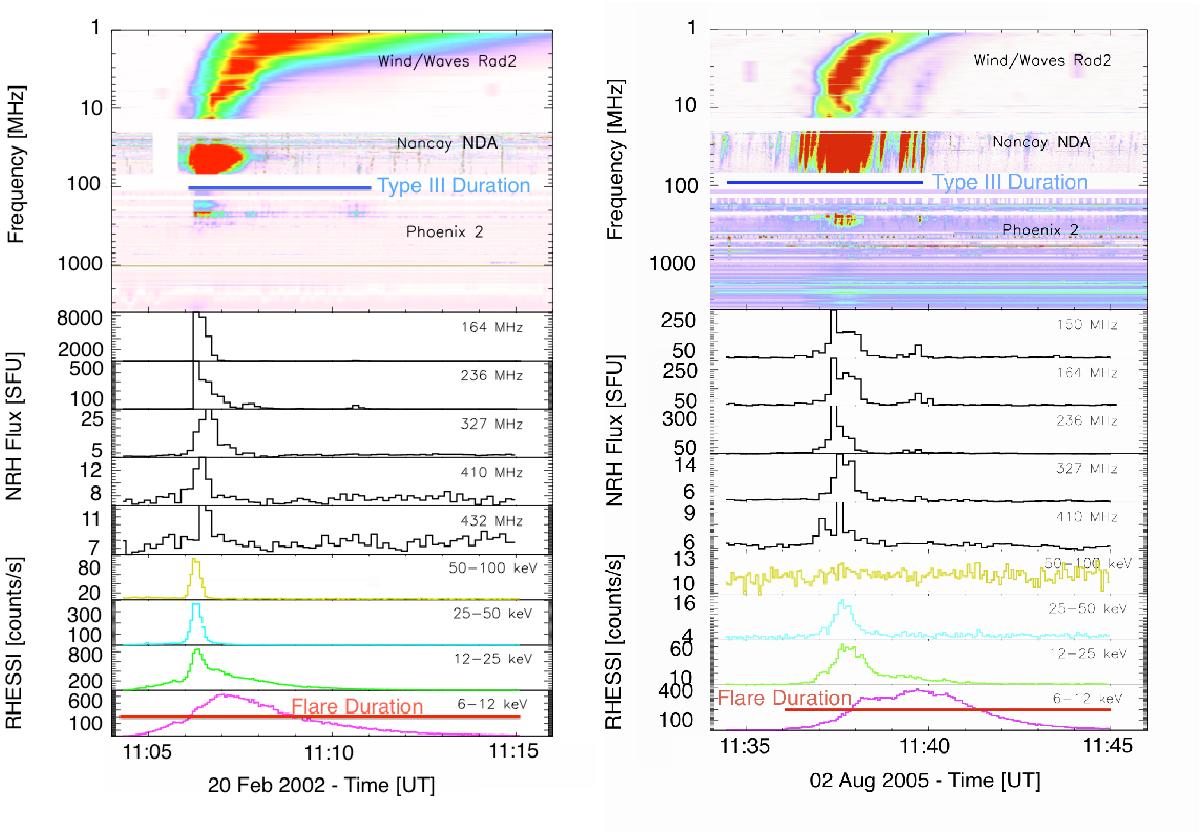
Example of two events with associated type III radio and X-ray emissions. The spectrograms from top to bottom are the WIND/WAVES RAD2 (14 MHz to 1 MHz), Nançay Decametre Array (80 MHz to 15 MHz), and Phoenix 2 (4 GHz to 100 MHz). The light curves are from the Nançay Radioheliograph (432 MHz to 164 MHz) and RHESSI (6–12 to 50–100 keV). The blue line represents the duration of the coronal type III bursts as reported in the catalogues. The red line represents the X-ray flare duration at 6–12 keV as indicated in the catalogue. There is a linear scale for the light curves.
Current usage metrics show cumulative count of Article Views (full-text article views including HTML views, PDF and ePub downloads, according to the available data) and Abstracts Views on Vision4Press platform.
Data correspond to usage on the plateform after 2015. The current usage metrics is available 48-96 hours after online publication and is updated daily on week days.
Initial download of the metrics may take a while.