Free Access
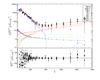
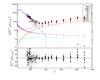
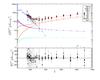
Fig. C.1
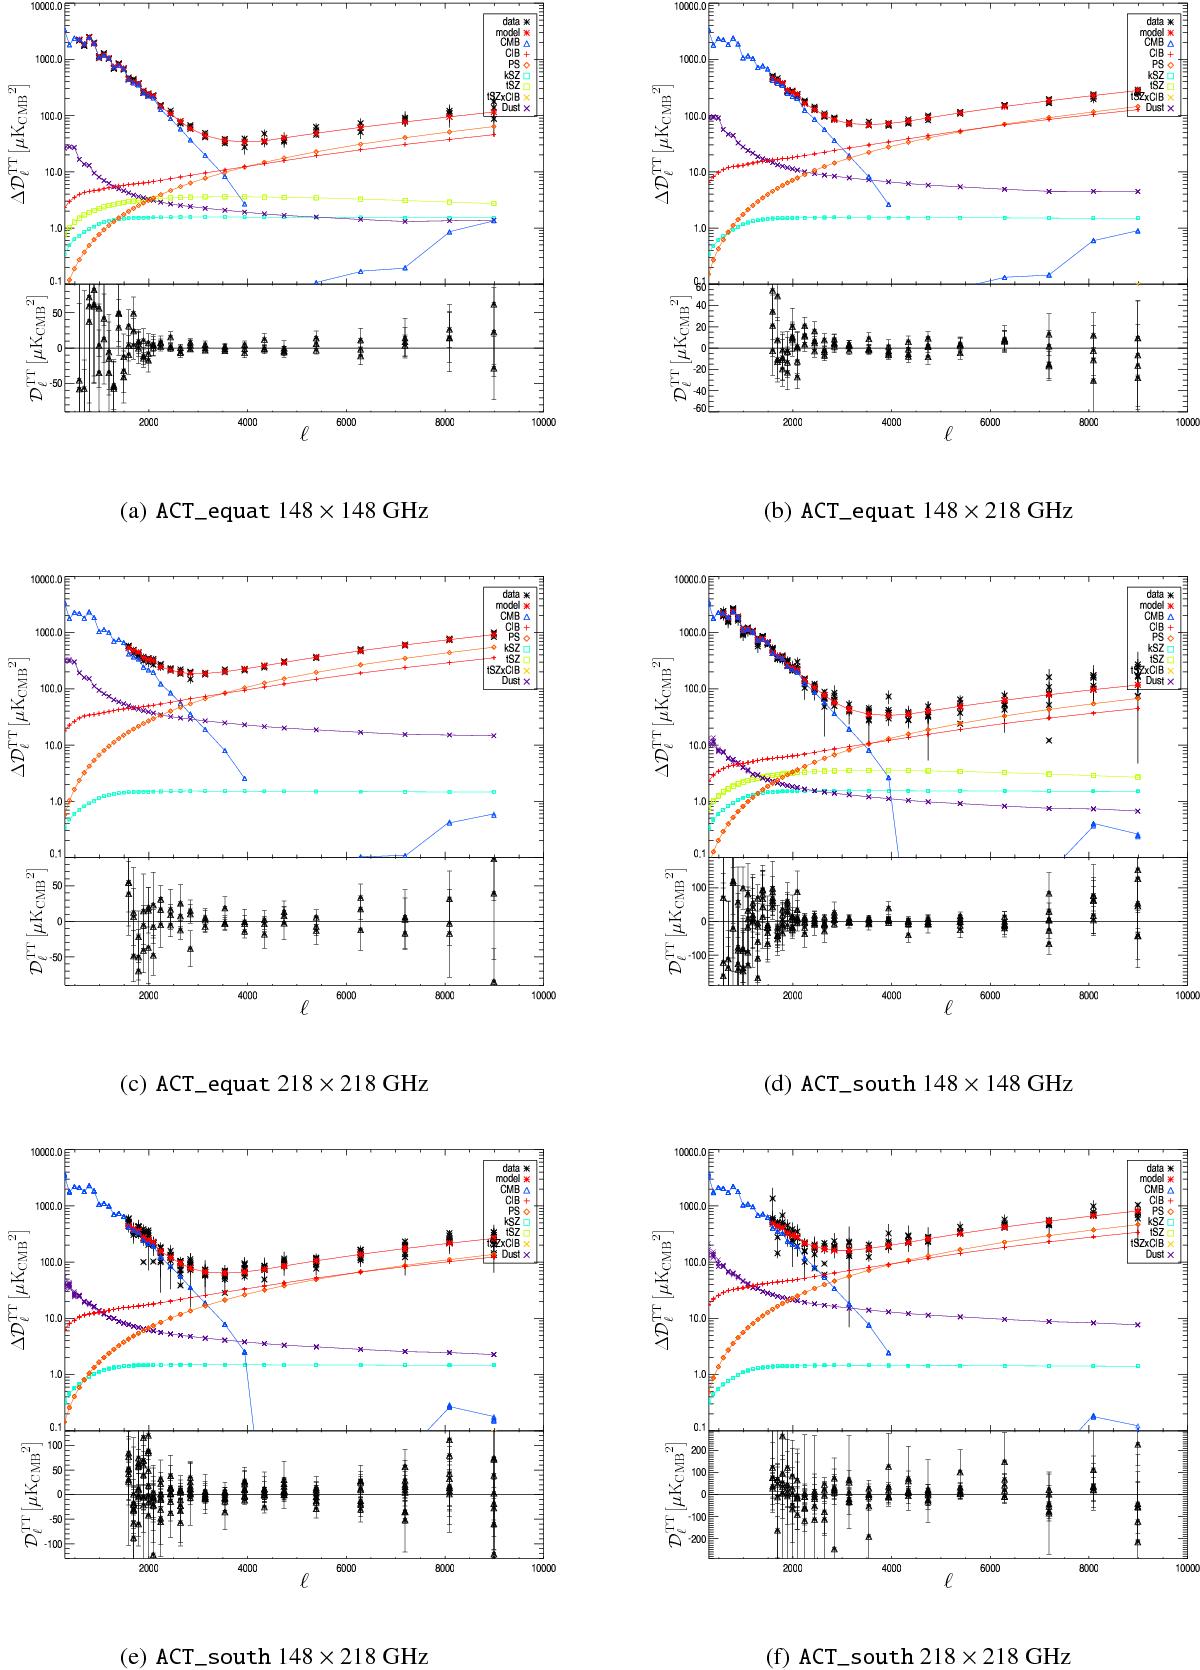
Power spectra of CMB and foregrounds as fitted by the Hillipop+VHL likelihood, compared with ACT data. The use of window functions explain why the CMB component sometimes reappears at the very end of the multipole range.
This figure is made of several images, please see below:
Current usage metrics show cumulative count of Article Views (full-text article views including HTML views, PDF and ePub downloads, according to the available data) and Abstracts Views on Vision4Press platform.
Data correspond to usage on the plateform after 2015. The current usage metrics is available 48-96 hours after online publication and is updated daily on week days.
Initial download of the metrics may take a while.