Fig. 6
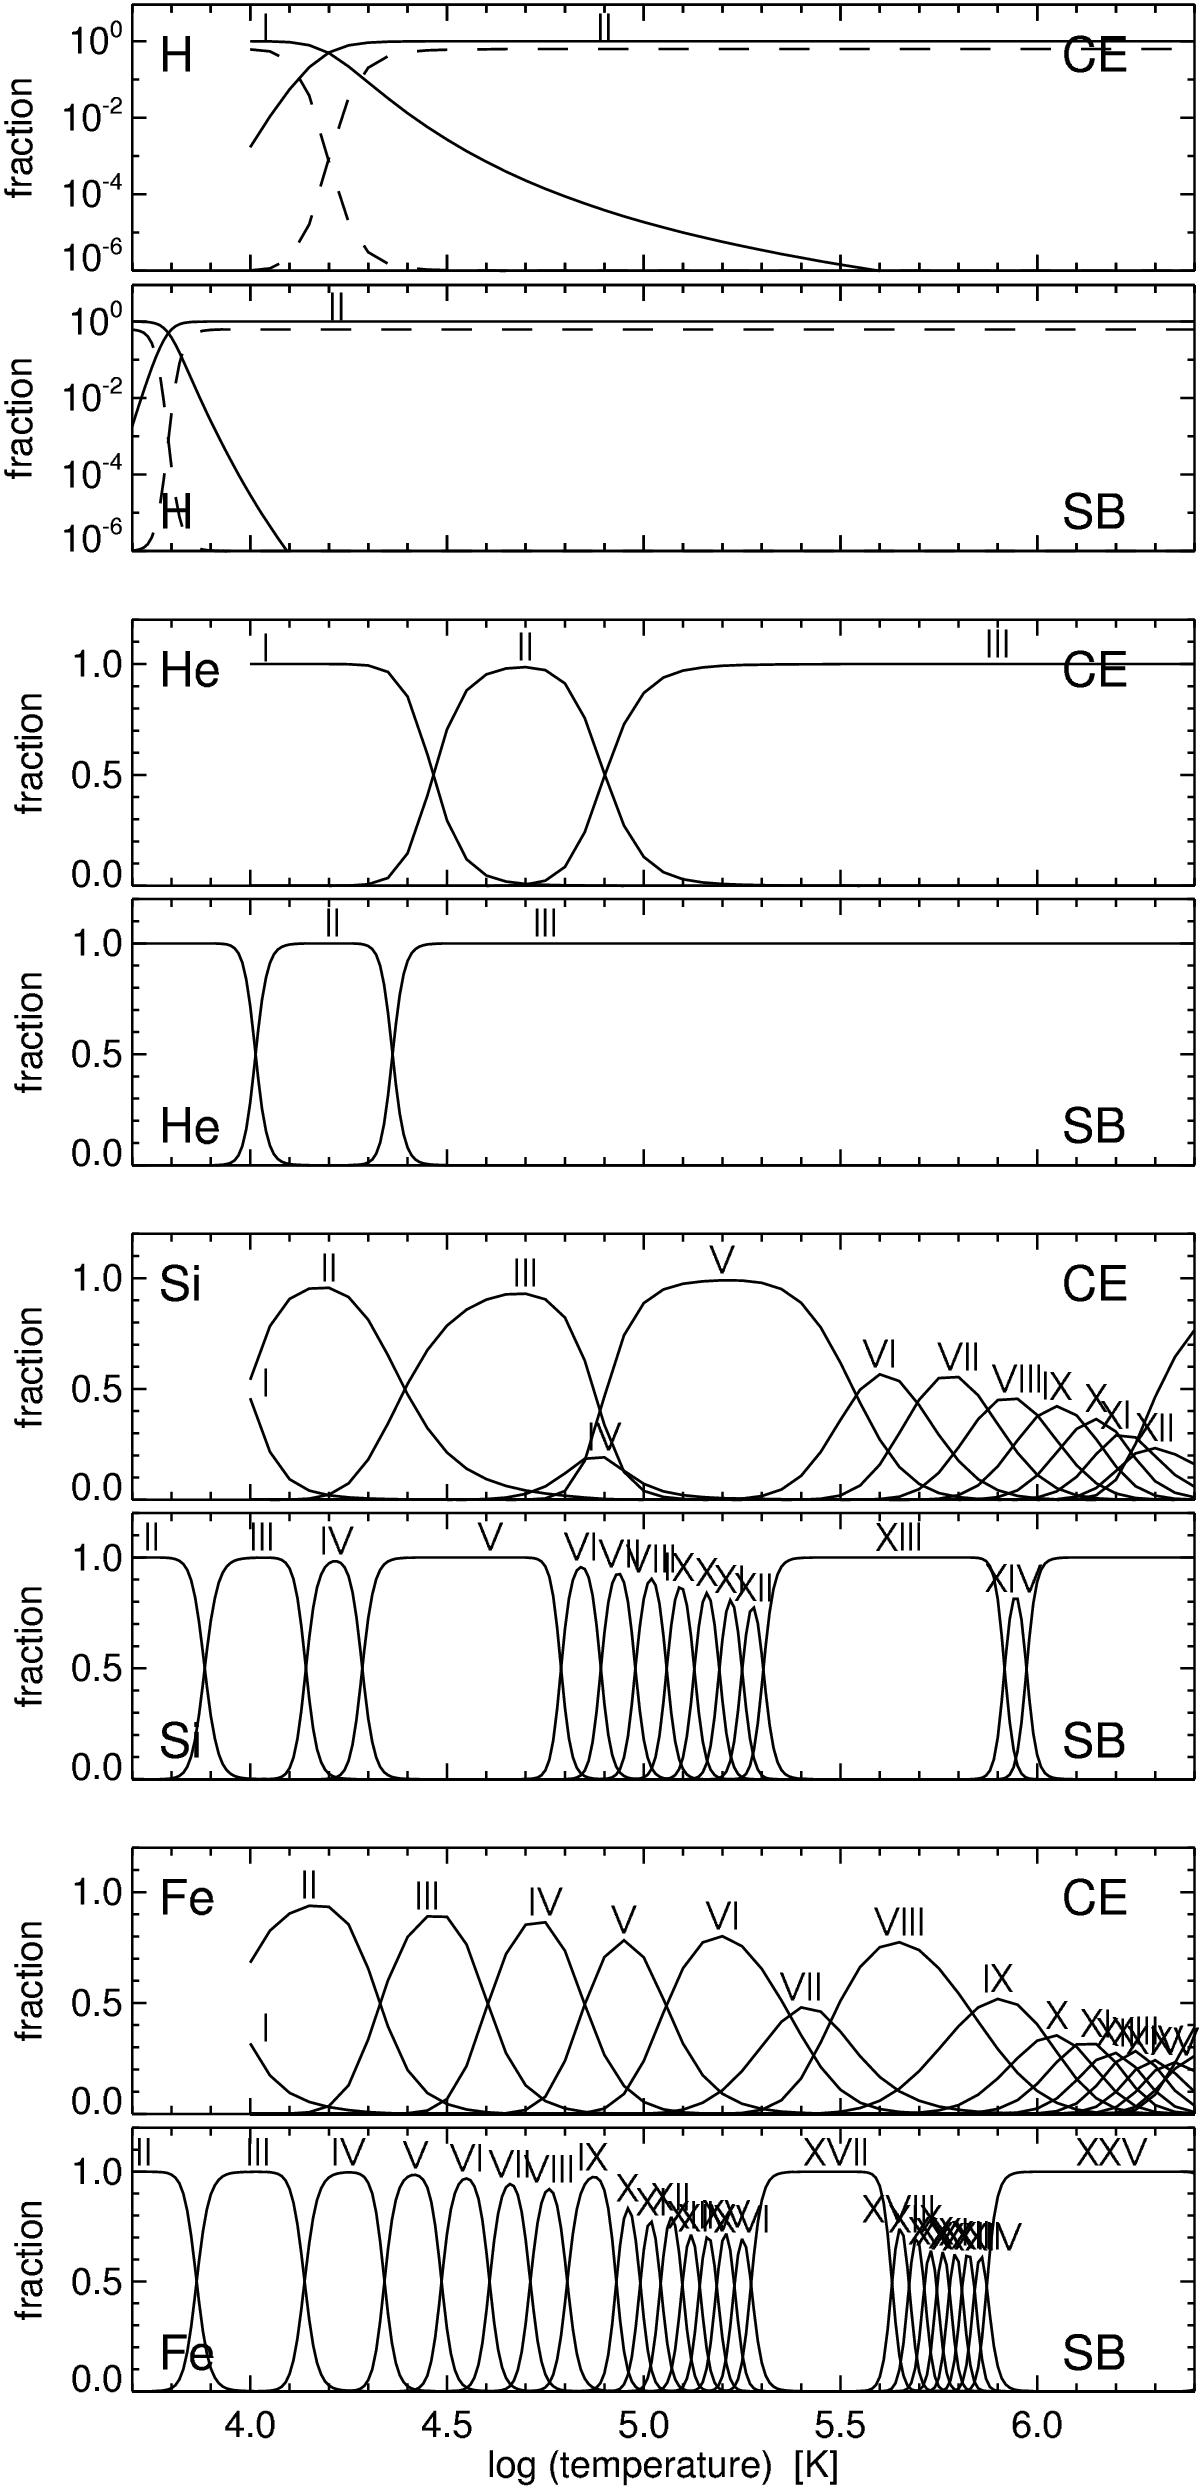
CE/SB ionization-stage population comparisons for H, He, Si and Fe. Upper panel of each pair: CE distribution with temperature. Lower panel of each pair: SB distribution with temperature for fixed electron density Ne = 1014 cm-3. For lower Ne the SB curve patterns remain similar but the flanks steepen and the peaks shift leftward (about −0.05 in log (T) for tenfold Ne reduction). The first pair for hydrogen has logarithmic y-axes; the dashed curves are on the linear scales of the other panels.
Current usage metrics show cumulative count of Article Views (full-text article views including HTML views, PDF and ePub downloads, according to the available data) and Abstracts Views on Vision4Press platform.
Data correspond to usage on the plateform after 2015. The current usage metrics is available 48-96 hours after online publication and is updated daily on week days.
Initial download of the metrics may take a while.