Fig. 5
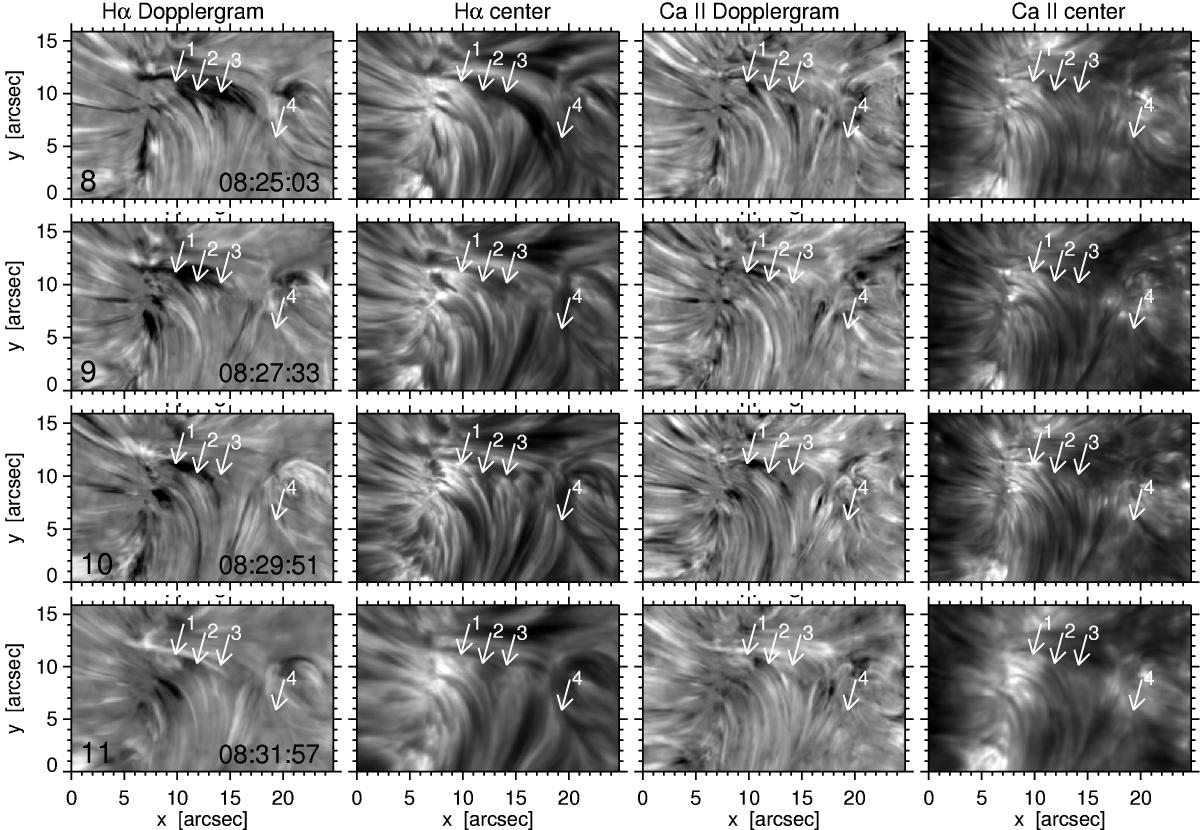
Time sequence of aftermath image cutouts as in Fig. 2. Columns: Hα Dopplergrams at Δλ = ± 0.6 Å with black denoting redshift. Hα images at line center, Ca II 8542 Å Dopplergrams at Δλ = ± 0.3 Å, Ca II 8542 Å images at line center. The first two rows are for the same moments as the last two rows in Fig. 2 and share their numbers. The intensity images are bytescaled individually but the Dopplergrams have identical greyscales along columns.
Current usage metrics show cumulative count of Article Views (full-text article views including HTML views, PDF and ePub downloads, according to the available data) and Abstracts Views on Vision4Press platform.
Data correspond to usage on the plateform after 2015. The current usage metrics is available 48-96 hours after online publication and is updated daily on week days.
Initial download of the metrics may take a while.