Fig. 4
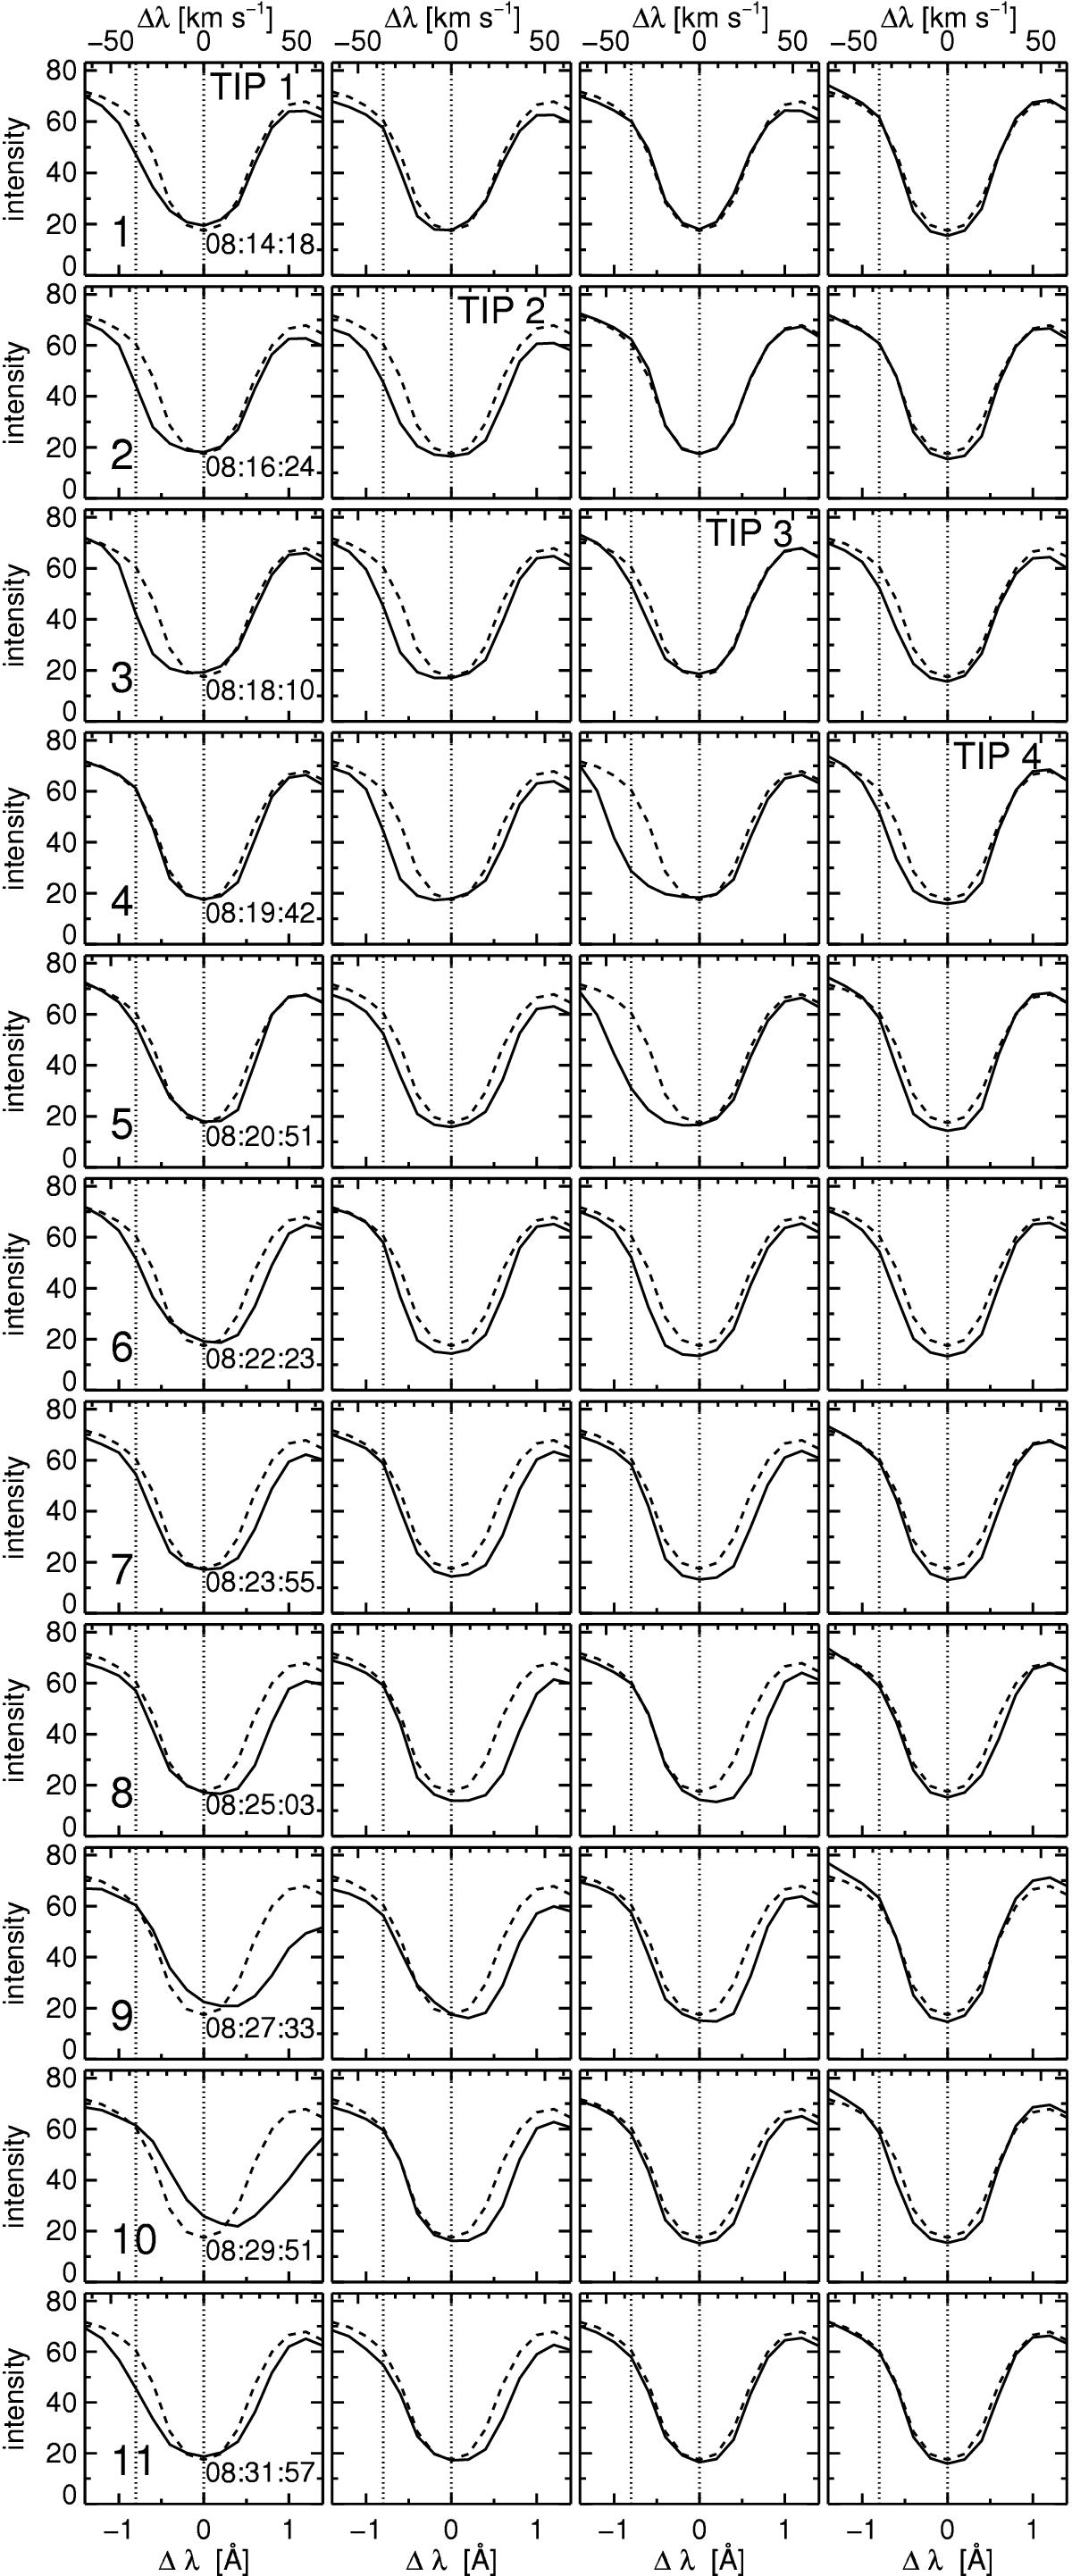
Hα profiles at the four locations marked by arrows in Fig. 2. The wavelength separation from line center is given in Å at the bottom, in km s-1 at the top. The intensity scale is arbitrary. The first nine rows are the same time samplings and have the same numbers as in Fig. 2, similarly specified in the first column. The last four rows are for the same times as in Fig. 5. The columns correspond to the initial precursor-tip locations marked by the four arrows in Fig. 2. The panels for their defining moment are labeled “TIP” in the first four rows. Solid: Hα profile at this location and time. Dashed: mean profile of the whole sequence for reference, identical in all panels. Dotted, vertical: sampling wavelengths used in Fig. 2.
Current usage metrics show cumulative count of Article Views (full-text article views including HTML views, PDF and ePub downloads, according to the available data) and Abstracts Views on Vision4Press platform.
Data correspond to usage on the plateform after 2015. The current usage metrics is available 48-96 hours after online publication and is updated daily on week days.
Initial download of the metrics may take a while.