Fig. 2
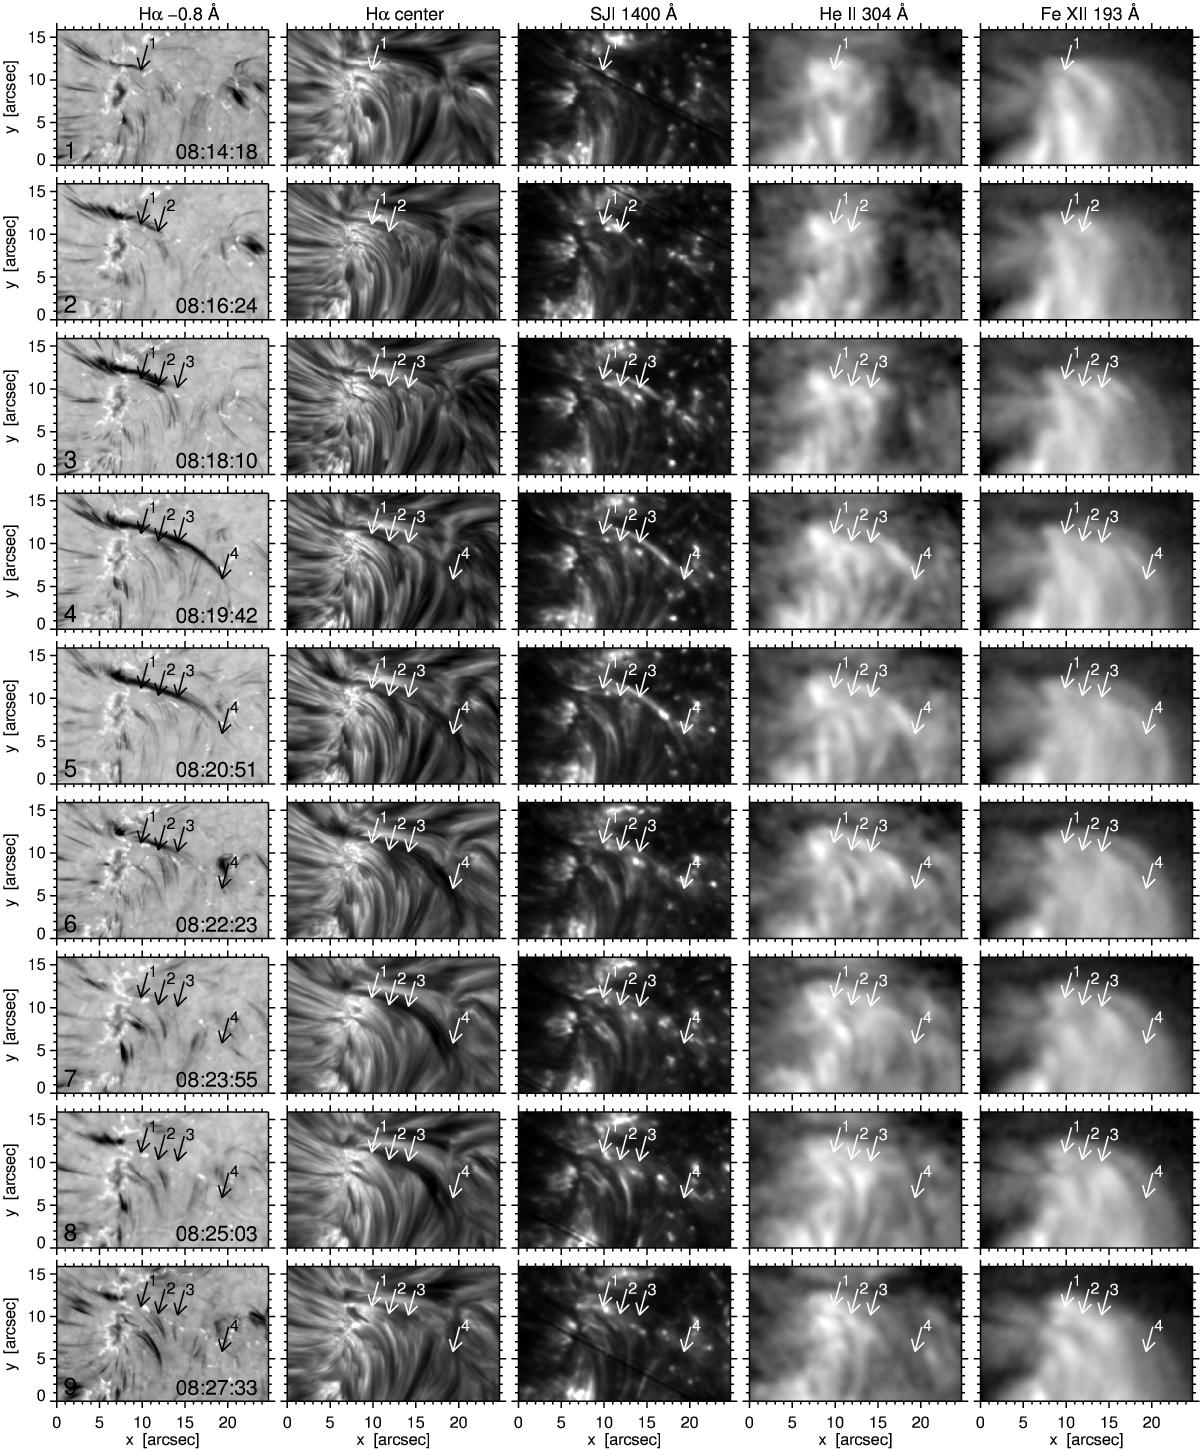
Time sequence of image cutouts defined by the subfield frame in Fig. 1. The row number and the observing moment of each row are specified in the first panel of each row. Columns: Hα images at Δλ = −0.8 Å from line center (SST), Hα line center (SST), 1400 Å slitjaw (IRIS), He II 304 Å (AIA), Fe XII 193 Å (AIA). The four numbered arrows mark the location of the tip of the dark extending precursor streak defined successively for the first four Hα blue-wing panels. Each frame is bytescaled individually. Row 6 corresponds to Fig. 1. The IRIS slit is visible in the top two and bottom two 1400 Å panels.
Current usage metrics show cumulative count of Article Views (full-text article views including HTML views, PDF and ePub downloads, according to the available data) and Abstracts Views on Vision4Press platform.
Data correspond to usage on the plateform after 2015. The current usage metrics is available 48-96 hours after online publication and is updated daily on week days.
Initial download of the metrics may take a while.