Free Access
Fig. 13
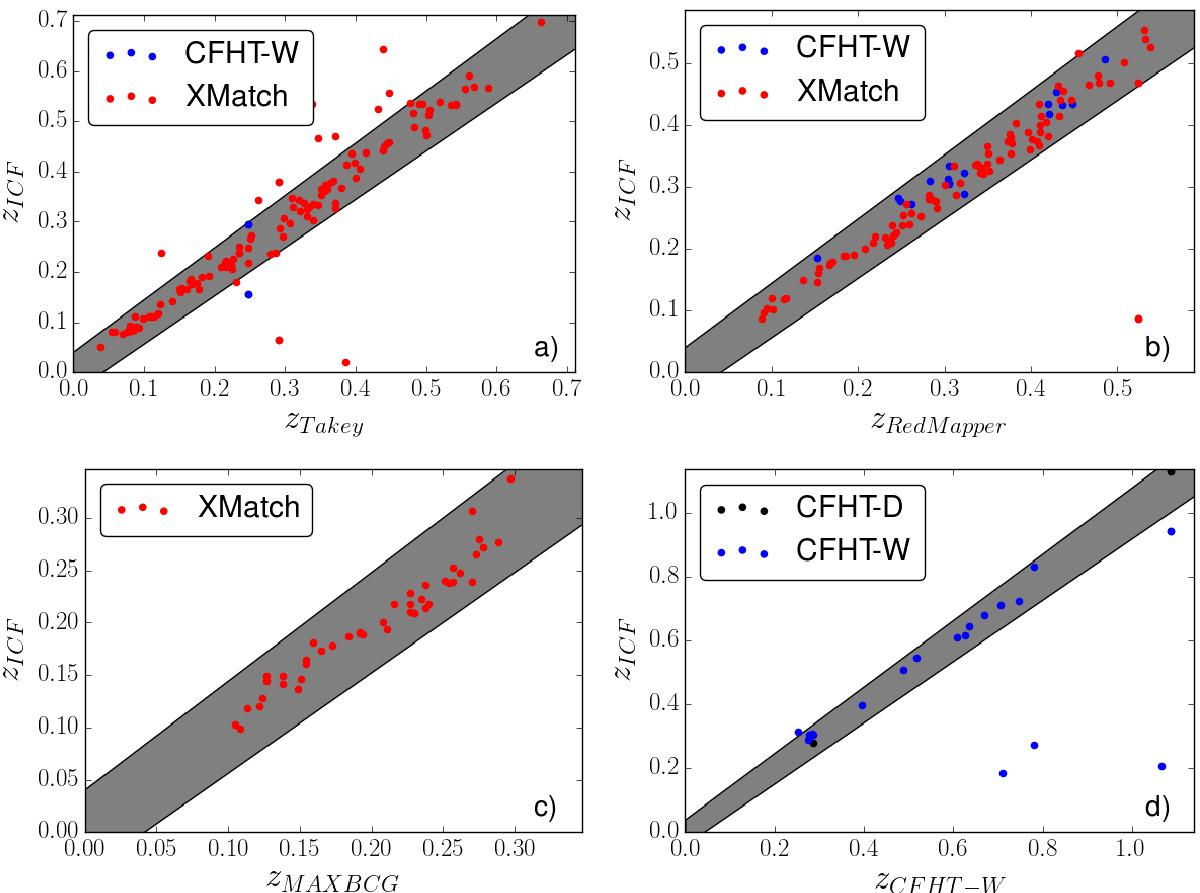
Redshifts for detected clusters from other catalogues: a) Takey et al. (2013); b) Rykoff et al. (2014); c) Koester et al. (2007); and d)Wen & Han (2011). Colour of points indicate data used by ICF to detect clusters. Shaded region corresponds to 4% error in redshift.
Current usage metrics show cumulative count of Article Views (full-text article views including HTML views, PDF and ePub downloads, according to the available data) and Abstracts Views on Vision4Press platform.
Data correspond to usage on the plateform after 2015. The current usage metrics is available 48-96 hours after online publication and is updated daily on week days.
Initial download of the metrics may take a while.