Free Access
Fig. 12
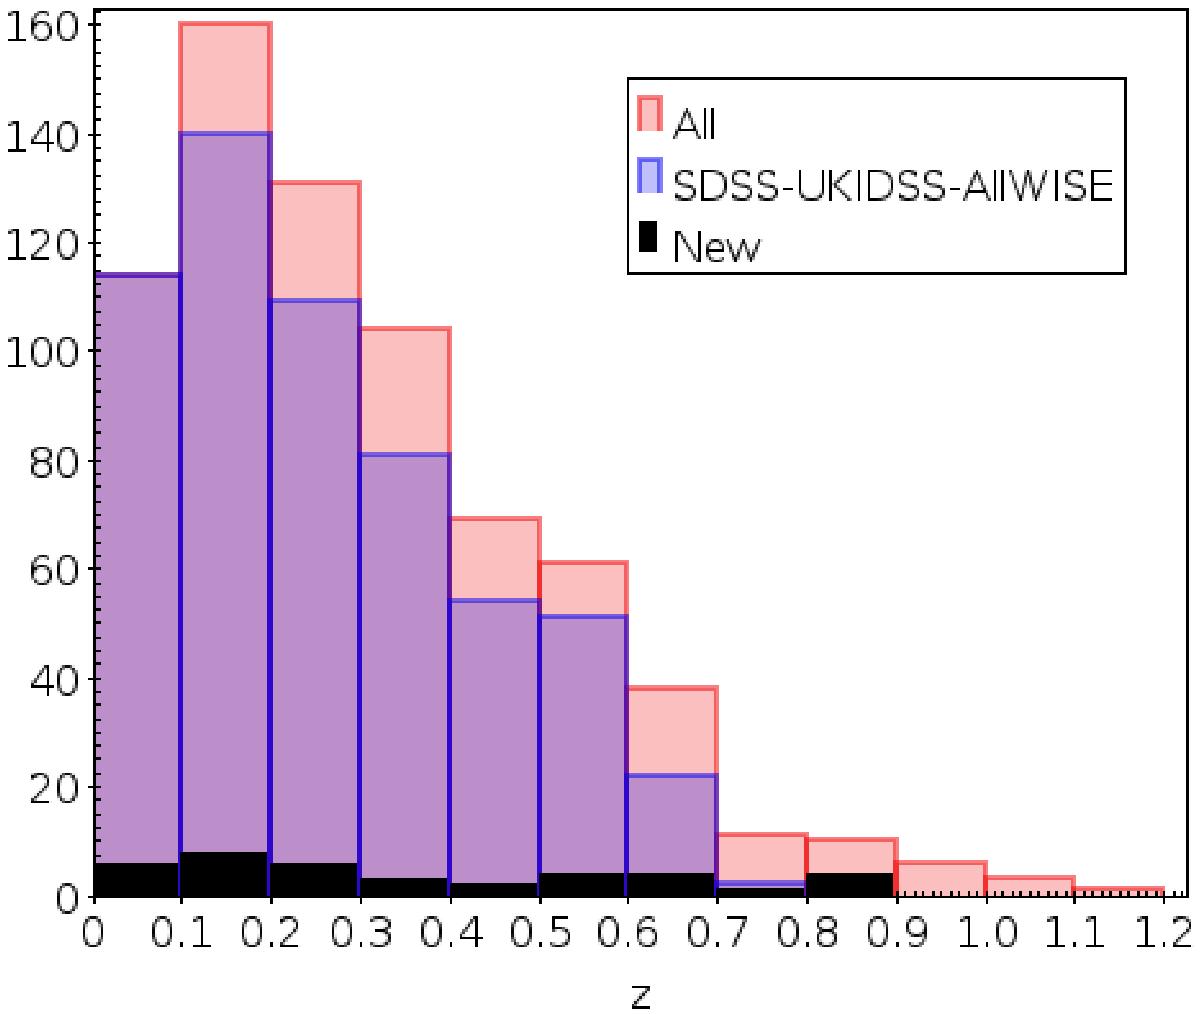
Redshift distribution for detected clusters. The red histogram shows non-duplicate clusters detected with all methods; the blue histogram shows only those detected with SDSS-UKIDSS-AllWISE combination; and the black histogram shows new clusters.
Current usage metrics show cumulative count of Article Views (full-text article views including HTML views, PDF and ePub downloads, according to the available data) and Abstracts Views on Vision4Press platform.
Data correspond to usage on the plateform after 2015. The current usage metrics is available 48-96 hours after online publication and is updated daily on week days.
Initial download of the metrics may take a while.