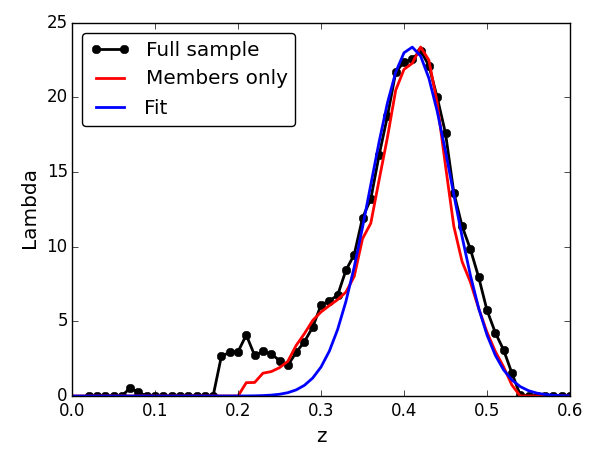
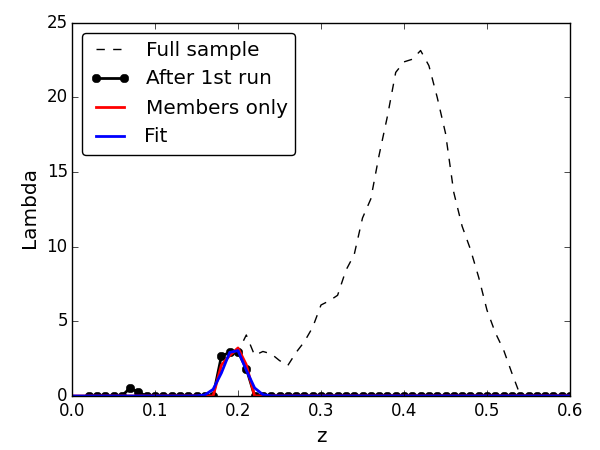
Fig. 1
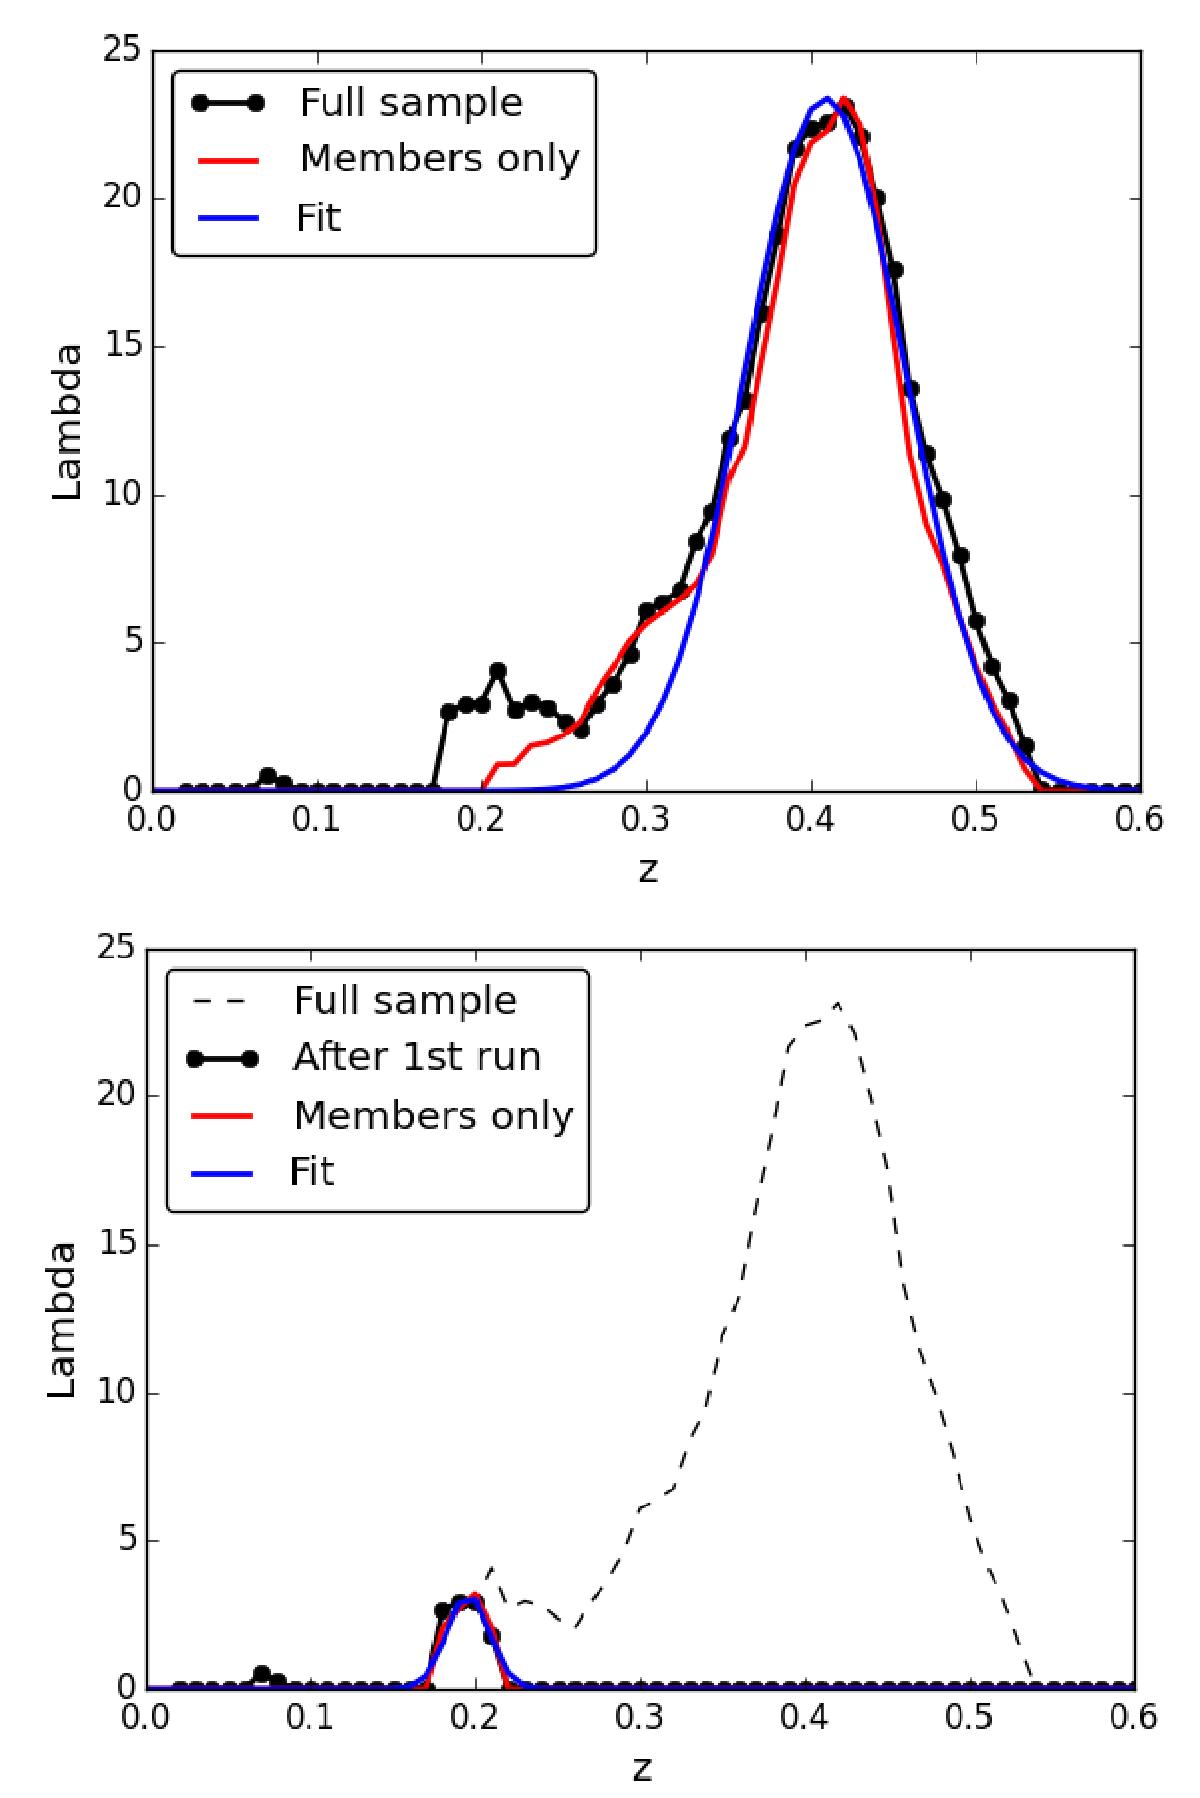
Peak finding algorithm illustration. Multiplicity function for the input sample is shown as black curves. A subsample of possible members of a cluster is selected. Multiplicity function of this subsample (red curves) is then fitted with a Gaussian (blue curves). Possible members are then removed from the sample and the rest are taken as an input for the next iteration. Upper panel shows the first iteration. Lower panel shows the second iteration with the total multiplicity function shown with a thin dashed line for reference. See text for details.
Current usage metrics show cumulative count of Article Views (full-text article views including HTML views, PDF and ePub downloads, according to the available data) and Abstracts Views on Vision4Press platform.
Data correspond to usage on the plateform after 2015. The current usage metrics is available 48-96 hours after online publication and is updated daily on week days.
Initial download of the metrics may take a while.