Fig. 7
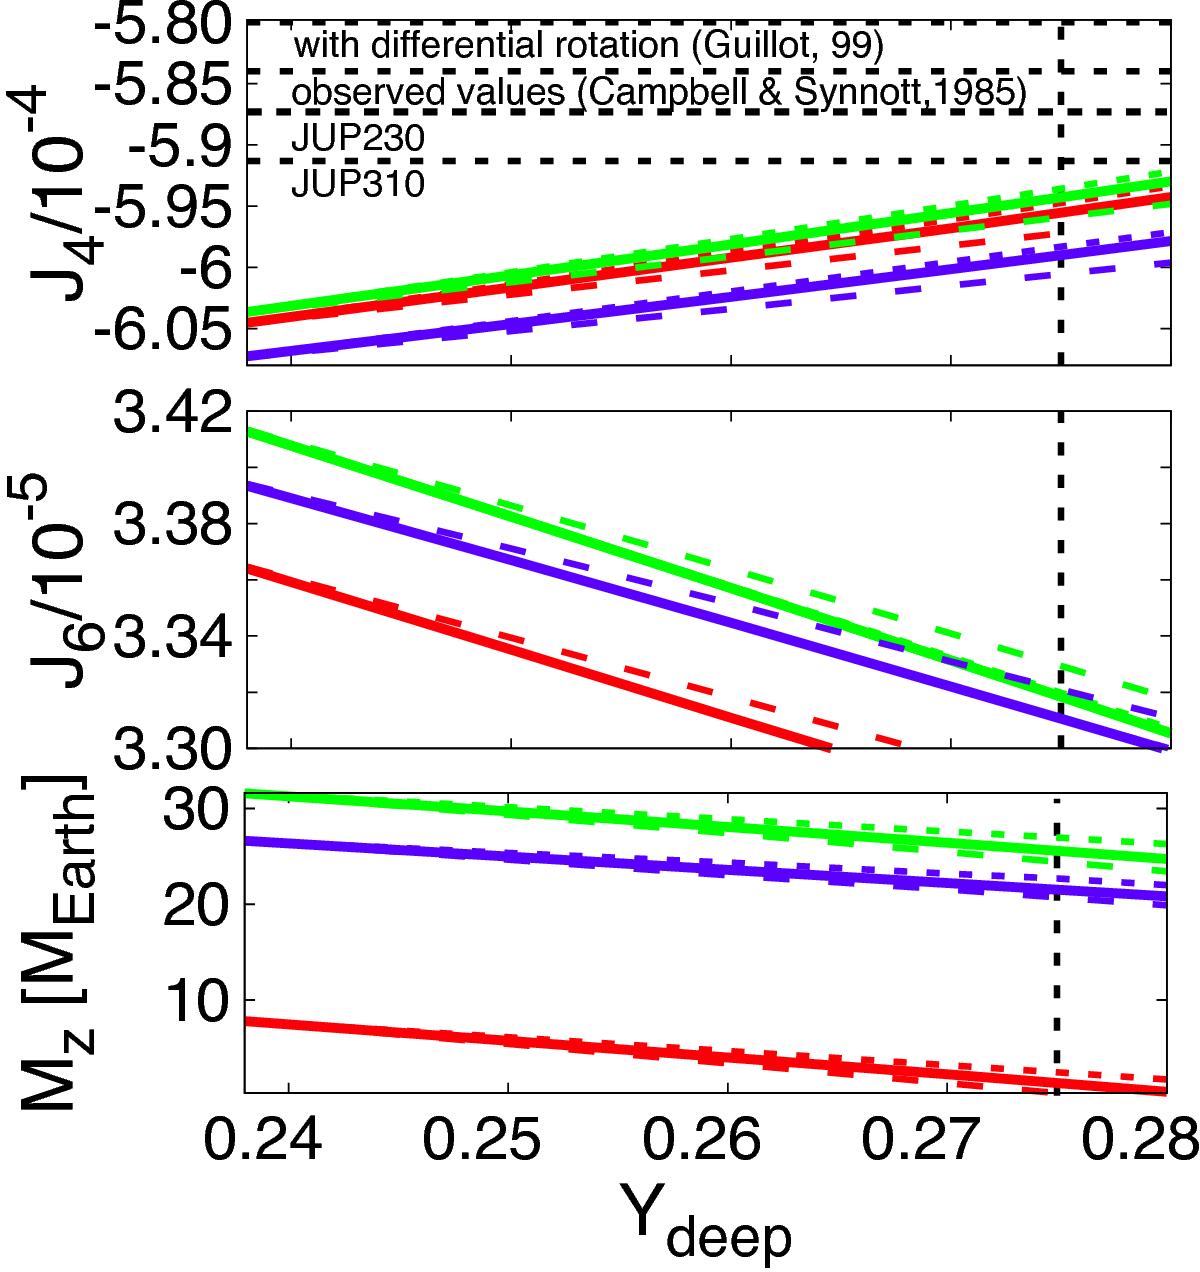
Model results when adjusting the mass of the core and heavy elements to reproduce the radius and J2 of Jupiter. In these models the atmospheric helium mass mixing-ratio is fixed to Yatm = 0.238, and we change the helium abundance in the deeper layer to match the protosolar value within its error bars. Different panels show J4 (upper panel), J6 (middle panel), and MZ (lower panel). Different colors show results for the three different equations of state of hydrogen and helium: SCvH (green), MH13+SCvH (red), and REOS3b (blue). The lines indicate different locations of the helium phase that separates the two envelopes at 0.8 Mbar (dashed), 2 Mbar (solid), and 4 Mbar (dotted lines). The vertical dashed line indicates the protosolar helium mixing ratio, and the horizontal lines in the upper panel show estimates of J4 from observations and models as a reference.
Current usage metrics show cumulative count of Article Views (full-text article views including HTML views, PDF and ePub downloads, according to the available data) and Abstracts Views on Vision4Press platform.
Data correspond to usage on the plateform after 2015. The current usage metrics is available 48-96 hours after online publication and is updated daily on week days.
Initial download of the metrics may take a while.