| Issue |
A&A
Volume 618, October 2018
|
|
|---|---|---|
| Article Number | C2 | |
| Number of page(s) | 6 | |
| Section | Planets and planetary systems | |
| DOI | https://doi.org/10.1051/0004-6361/201629732e | |
| Published online | 09 October 2018 | |
Corrigendum
Jupiter internal structure: the effect of different equations of state (Corrigendum)★
1
Laboratoire Lagrange, UMR 7293, Université de Nice-Sophia Antipolis, CNRS, Observatoire de la Côte dAzur, Bd de l’Observatoire, CS 34229,
06304
Nice Cedex 4,
France
e-mail: yamila.miguel@oca.eu
2
Institut de Physique du Globe de Paris,
1 Rue Jussieu,
75005
Paris,
France
3
AstroParticule et Cosmologie,
10 Rue Alice Domon et Léonie Duquet,
75013
Paris,
France
Key words: planets and satellites: interiors / planets and satellites: individual: Jupiter / equation of state / errata, addenda
Full appendix tables are only available at CDS via anonymous ftp to cdsarc.u-strasbg.fr (130.79.128.5) or via http://cdsarc.u-strasbg.fr/viz-bin/qcat?J/A+A/618/C2
After publication of Miguel et al. (2016), we found an error in the calculation of Jupiter internal structure when using REOS3b-H and REOS3sc-H equations of state (EOSs). The lowest pressure in those tables (see appendix in Miguel et al. 2016) was P = 31.623 bars, while our calculations of Jupiter’s internal structure started at P = 1 bar. This difference lead to an extrapolation of the EOS of hydrogen, which caused an overestimation of Jupiter’s interior calculations. We fixed this problem by using the SCvH-H EOS (Saumon et al. 1995) for pressures lower than 6 kbar and merged it with REOS3b-H and REOS3sc-H (correspondingly) for higher pressures.
There was also a small offset of ~2% in the specific entropy at low pressures (P < 1 kbar) between the REOS3b and REOS3sc tables with respect to the SCvH table, caused by a small difference in the s0 parameter chosen to calculate the specific entropy. In Miguel et al. (2016), this parameter was determined calculating s − s0 from equation 14 at T = 29 500 K and ρ = 0.036 g cc−1 and then using the value of s in SCvH EOS at the same conditions. This temperature was much higher than the border condition in our interior models (at 165 K) and the intrinsic differences between the tables at those conditions lead to the offset in the specific entropy. In order to fix this issue, we performed new calculations at T = 150 K and ρ = 0.3 g cc−1, which corrected the offset in S between the EOSs.
We also improved our method for calculating the gravity harmonics. Following Nettelmann (2017) and using results calculated with the more accurate CMS method (Hubbard 2013) as a comparison, we corrected the coefficients of the theory of figures of fourth order and improved the numerical handling of density discontinuities. With these improvements, the results agree with Nettelmann et al. (2012) and Hubbard & Militzer (2016). The differences from previous calculations are of the order of 6 × 10⁻⁷ in J2, 1.4 × 10⁻⁸ in J4, 2 × 10⁻⁶ in J6 and 6 × 10⁻⁸ in J8.
We thus ran our simulations again and show the corrected figures below. We also include the corrected EOS tables (see Appendix A). For comparison purposes, the MH13+SCvH table for pure hydrogen was also recalculated by accounting for the entropy of mixing.
Along a fixed adiabat, Jupiter’s internal temperature is found to be 10% smaller with the new REOS3b table compared to the previous calculation. Nevertheless, the trend remains the same, with REOS3b models being the warmest and MH13 ones the coldest. The core masses found with REOS3b are now 5 < Mcore < 16 MEarth, i.e., the lower limit is about 2 MEarth smaller than previous calculations. The mass of heavy elements found with REOS3b is significantly lower than previously, being now 13 < MZ < 27 MEarth instead of 20 − 40 MEarth previously. The space of solutions of Mcore and MZ found with MH13 is almost the same as before with 1 < MZ < 8 MEarth and 10 < Mcore < 17 MEarth compared with our previous estimations 1–7 MEarth and 11–17 MEarth, correspondingly. Due to the changes in the calculation of gravity harmonics, the results using SCvH also changed. The core masses remain unchanged but MZ changed from 18–44 MEarth to 23–36 MEarth.
The new results still show that the internal structure of Jupiter strongly depends on the accuracy of the EOSs. The differences between the MH13 and REOS3 solutions remain significant, in particular in terms of the total mass of heavy elements in the envelope. The location at which helium rain occurs still controls to a large extent the inferred core mass. The main conclusions of the paper therefore remain unchanged.
We wish to apologise for this oversight. We thank Burkhard Militzer for noticing the EOS issue. We also thank William B. Hubbard and Nadine Nettelmann who shared codes and algorithms that allowed an accurate comparison of gravitational moments.
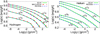 |
Fig. 3 Specific entropy vs. density at different temperatures for hydrogen (left panel) and helium (right panel). Given the small changes in the EOS, the differences between this figure and Fig. 3 in Miguel et al. (2016) are not visible. |
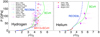 |
Fig. 4 Principal Hugoniot of hydrogen (left panel) and helium (right panel). Due to the small changes in the EOS there is no visible change in the Hugoniot curves. |
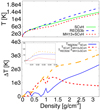 |
Fig. 5 Interior structure of Jupiter calculated with REOS3b. This has a lower temperature (and higher density) than the one in Miguel et al. (2016). The bottom panel shows that differences in temperature between the profiles obtained with different EOS is less than 20 K and before the differences were up to 400 K for the same density range (top left small panel). |
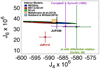 |
Fig. 6 Values of the gravitational moments J4 and J6 . This figure includes an up-to-date calculation of the model J4 and J6 (see text). It was rotated in order to adopt the same convention as other publications (e.g. Bolton et al. 2017). |
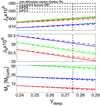 |
Fig. 7 Heavy element masses. The main differences compared with the previous results is the change in J6 and the mass of heavy elements. The mass of heavy elements with REOS3b is smaller than in the previous results. |
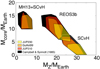 |
Fig. 8 Mass of the core and heavy elements in the interior of Jupiter derived with different Js . The ranges of core masses are the same as those in Miguel et al. (2016) for SCvH and MH13, and the lower limit changed from 7 to 5 M⊕ for REOS3b. The mass of heavy elements that we get when using REOS3b is smaller in all cases. |
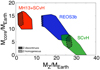 |
Fig. 9 Areas in the mass of the core and heavy elements space correspond to solutions found with different equations of state: SCvH (green), MH13+SCvH (red) and REOS3b (blue area). The space of solutions obtained with REOS3b has shifted towards solutions with a lower mass of heavy elements compared with Miguel et al. (2016). Miguel et al. 2016. We also find fewer solutions that have a high mass of heavy elements for SCvH. The range of solutions for the core mass remain unchanged for SCvH and MH13 and for REOS3b the lower limit is 5 M⊕ compared with 7 M⊕ before. |
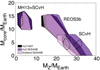 |
Fig. 10 Space of solutions obtained with different equations of state for H and He and for heavy elements. Solutions with REOS3b shifted to lower masses of heavy elements. We obtain fewer solutions with SCvH. |
 |
Fig. 11 Results of optimization models with different equations of state for H and He and changing the location of the PSep : 4 Mbar (black), 2 Mbar (blue), 1 Mbar (green), and 0.8 Mbar (light blue). As in previous figures, solutions with REOS3b have a lower mass of heavy elements. When using a PSep = 4 Mbar and REOS3b, we find lower core masses that go as low as 2 MEarth. |
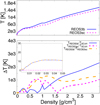 |
Fig. 12 Jupiter’s stucture with REOS3sc. It has lower temperatures than in Miguel et al. (2016) and is much closer to the profile obtained with SCvH for lower densities. |
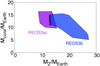 |
Fig. 13 Range of core masses and mass of heavy elements. This range has changed for both EOS. For REOS3b see previous figures and main text, for the case of REOS3sc, the new ranges are Mcore 10–17 M⊕ and MZ 8–16 M⊕, compared to Mcore 7–17 M⊕ and MZ 13–32 M⊕ in previous calculations. |
Appendix A Equations of state
REOS3b table for hydrogen.
REOS3b table for helium.
REOS3sc table for hydrogen.
REOS3sc table for helium.
MH13+SCvH table for hydrogen.
References
- Bolton, S. J., Adriani, A., Adumitroaie, V., et al. 2017, Science, 356, 821 [NASA ADS] [CrossRef] [Google Scholar]
- Hubbard, W. B. 2013, ApJ, 768, 43 [NASA ADS] [CrossRef] [Google Scholar]
- Hubbard, W. B., & Militzer, B. 2016, ApJ, 820, 80 [NASA ADS] [CrossRef] [Google Scholar]
- Miguel, Y., Guillot, T., & Fayon, L. 2016, A&A, 596, A114 [NASA ADS] [CrossRef] [EDP Sciences] [Google Scholar]
- Nettelmann, N. 2017, A&A, 606, A139 [NASA ADS] [CrossRef] [EDP Sciences] [Google Scholar]
- Nettelmann, N., Becker, A., Holst, B., & Redmer, R. 2012, ApJ, 750, 52 [NASA ADS] [CrossRef] [Google Scholar]
- Saumon, D., Chabrier, G., & van Horn, H. M. 1995, ApJS, 99, 713 [NASA ADS] [CrossRef] [Google Scholar]
© ESO, 2018
All Tables
All Figures
|
Fig. 3 Specific entropy vs. density at different temperatures for hydrogen (left panel) and helium (right panel). Given the small changes in the EOS, the differences between this figure and Fig. 3 in Miguel et al. (2016) are not visible. |
| In the text | |
|
Fig. 4 Principal Hugoniot of hydrogen (left panel) and helium (right panel). Due to the small changes in the EOS there is no visible change in the Hugoniot curves. |
| In the text | |
|
Fig. 5 Interior structure of Jupiter calculated with REOS3b. This has a lower temperature (and higher density) than the one in Miguel et al. (2016). The bottom panel shows that differences in temperature between the profiles obtained with different EOS is less than 20 K and before the differences were up to 400 K for the same density range (top left small panel). |
| In the text | |
|
Fig. 6 Values of the gravitational moments J4 and J6 . This figure includes an up-to-date calculation of the model J4 and J6 (see text). It was rotated in order to adopt the same convention as other publications (e.g. Bolton et al. 2017). |
| In the text | |
|
Fig. 7 Heavy element masses. The main differences compared with the previous results is the change in J6 and the mass of heavy elements. The mass of heavy elements with REOS3b is smaller than in the previous results. |
| In the text | |
|
Fig. 8 Mass of the core and heavy elements in the interior of Jupiter derived with different Js . The ranges of core masses are the same as those in Miguel et al. (2016) for SCvH and MH13, and the lower limit changed from 7 to 5 M⊕ for REOS3b. The mass of heavy elements that we get when using REOS3b is smaller in all cases. |
| In the text | |
|
Fig. 9 Areas in the mass of the core and heavy elements space correspond to solutions found with different equations of state: SCvH (green), MH13+SCvH (red) and REOS3b (blue area). The space of solutions obtained with REOS3b has shifted towards solutions with a lower mass of heavy elements compared with Miguel et al. (2016). Miguel et al. 2016. We also find fewer solutions that have a high mass of heavy elements for SCvH. The range of solutions for the core mass remain unchanged for SCvH and MH13 and for REOS3b the lower limit is 5 M⊕ compared with 7 M⊕ before. |
| In the text | |
|
Fig. 10 Space of solutions obtained with different equations of state for H and He and for heavy elements. Solutions with REOS3b shifted to lower masses of heavy elements. We obtain fewer solutions with SCvH. |
| In the text | |
|
Fig. 11 Results of optimization models with different equations of state for H and He and changing the location of the PSep : 4 Mbar (black), 2 Mbar (blue), 1 Mbar (green), and 0.8 Mbar (light blue). As in previous figures, solutions with REOS3b have a lower mass of heavy elements. When using a PSep = 4 Mbar and REOS3b, we find lower core masses that go as low as 2 MEarth. |
| In the text | |
|
Fig. 12 Jupiter’s stucture with REOS3sc. It has lower temperatures than in Miguel et al. (2016) and is much closer to the profile obtained with SCvH for lower densities. |
| In the text | |
|
Fig. 13 Range of core masses and mass of heavy elements. This range has changed for both EOS. For REOS3b see previous figures and main text, for the case of REOS3sc, the new ranges are Mcore 10–17 M⊕ and MZ 8–16 M⊕, compared to Mcore 7–17 M⊕ and MZ 13–32 M⊕ in previous calculations. |
| In the text | |
Current usage metrics show cumulative count of Article Views (full-text article views including HTML views, PDF and ePub downloads, according to the available data) and Abstracts Views on Vision4Press platform.
Data correspond to usage on the plateform after 2015. The current usage metrics is available 48-96 hours after online publication and is updated daily on week days.
Initial download of the metrics may take a while.