Fig. 6
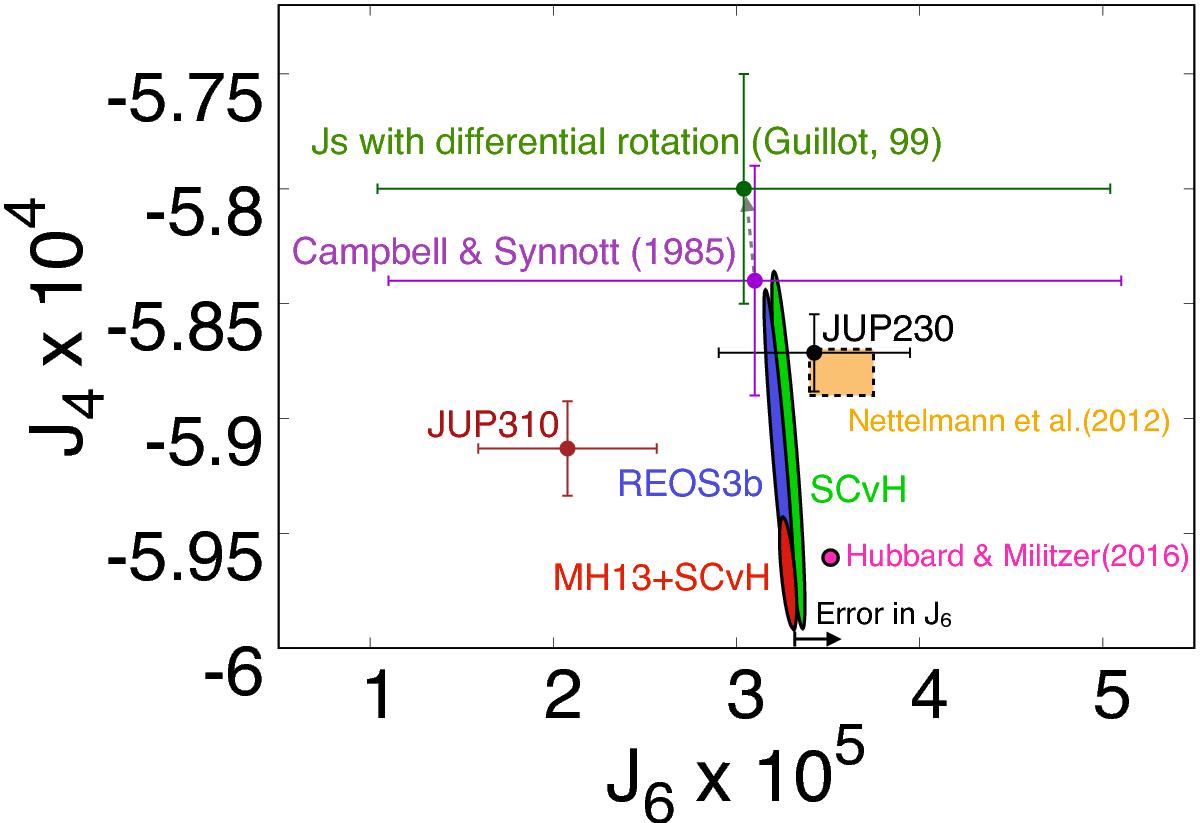
J4 and J6 pre-Juno observed values (Campbell & Synnott1985; purple), those with a correction due to differential rotation (Guillot 1999; dark green), and more recent estimates by Jacobson in 2003 (black) and 2013 (brown). Js solutions of our optimized models within 2σ of Campbell & Synnott (1985) and modeled with Z-discontinuous are shown in different colors according to the equation of state used in the simulation: SCvH (green), REOS3b (blue), and MH13+SCvH (red). The pink dot shows a recent model by Hubbard & Militzer (2016) and the orange box shows estimates by Nettelmann et al. (2012) for comparison.
Current usage metrics show cumulative count of Article Views (full-text article views including HTML views, PDF and ePub downloads, according to the available data) and Abstracts Views on Vision4Press platform.
Data correspond to usage on the plateform after 2015. The current usage metrics is available 48-96 hours after online publication and is updated daily on week days.
Initial download of the metrics may take a while.