Fig. 4
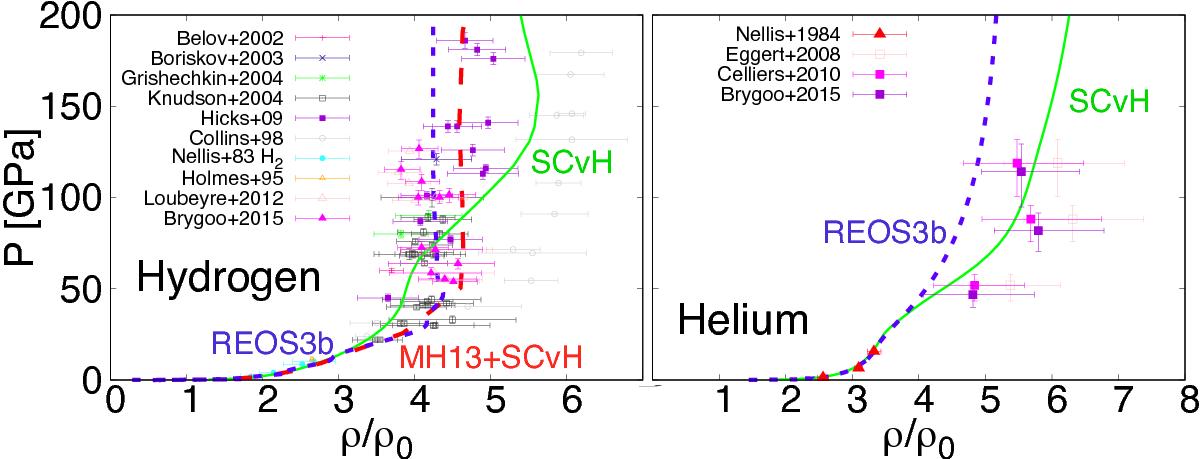
Principal Hugoniot of hydrogen (left panel) and helium (right panel). The curves were calculated for an initial state of ρ0 = 0.0855 g/cm3 and T0 = 20 K for hydrogen and ρ0 = 0.123 g/cm3 and T0 = 4 K for helium. Experimental results are shown with different point styles for comparison. We included recent estimates by Brygoo et al. (2015), who presented corrections of previously published data on He (Eggert et al. 2008; Celliers et al. 2010), H2 , and D2 (Loubeyre et al. 2012) based on a better understanding of shocked compressed SiO2.
Current usage metrics show cumulative count of Article Views (full-text article views including HTML views, PDF and ePub downloads, according to the available data) and Abstracts Views on Vision4Press platform.
Data correspond to usage on the plateform after 2015. The current usage metrics is available 48-96 hours after online publication and is updated daily on week days.
Initial download of the metrics may take a while.