Fig. 12
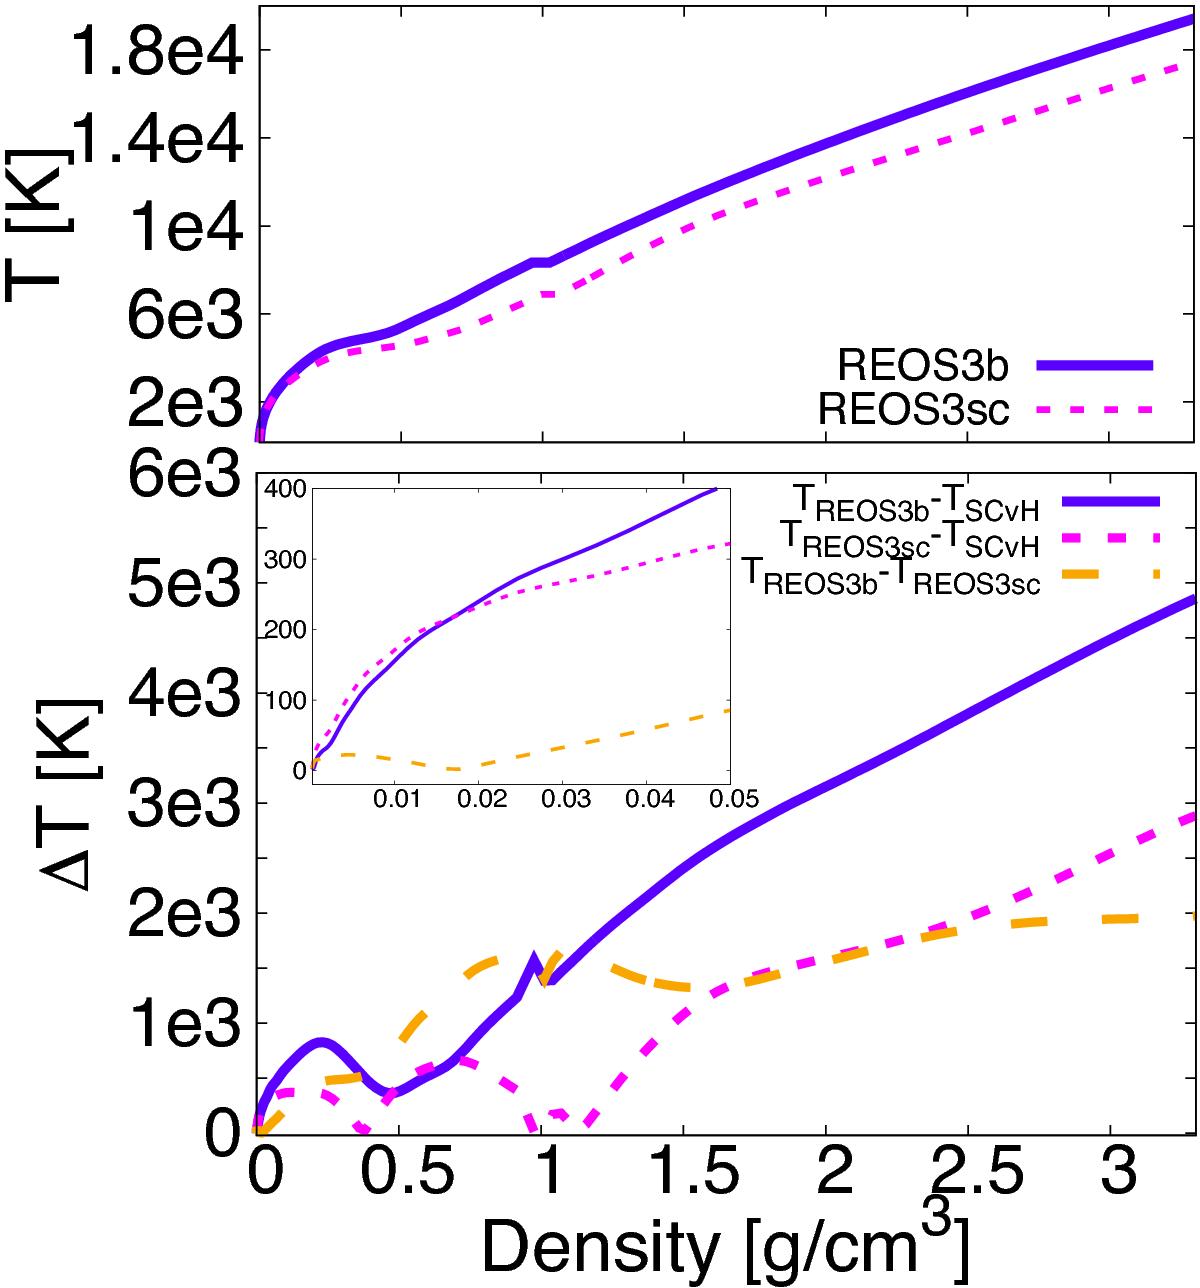
Thermal profile calculated for Jupiter when using two equations of state derived using different internal energies. Top panel shows temperature vs. density, where blue is REOS3b and dashed magenta line was obtained with our test case the REOS3sc eos. Lower panel shows the differences in temperatures derived with the different equations of state: blue line is the difference between REOS3b and SCvH, dashed magenta line is the difference between REOS3sc and SCvH and orange line is the difference between REOS3b and REOS3sc.
Current usage metrics show cumulative count of Article Views (full-text article views including HTML views, PDF and ePub downloads, according to the available data) and Abstracts Views on Vision4Press platform.
Data correspond to usage on the plateform after 2015. The current usage metrics is available 48-96 hours after online publication and is updated daily on week days.
Initial download of the metrics may take a while.