Fig. 1
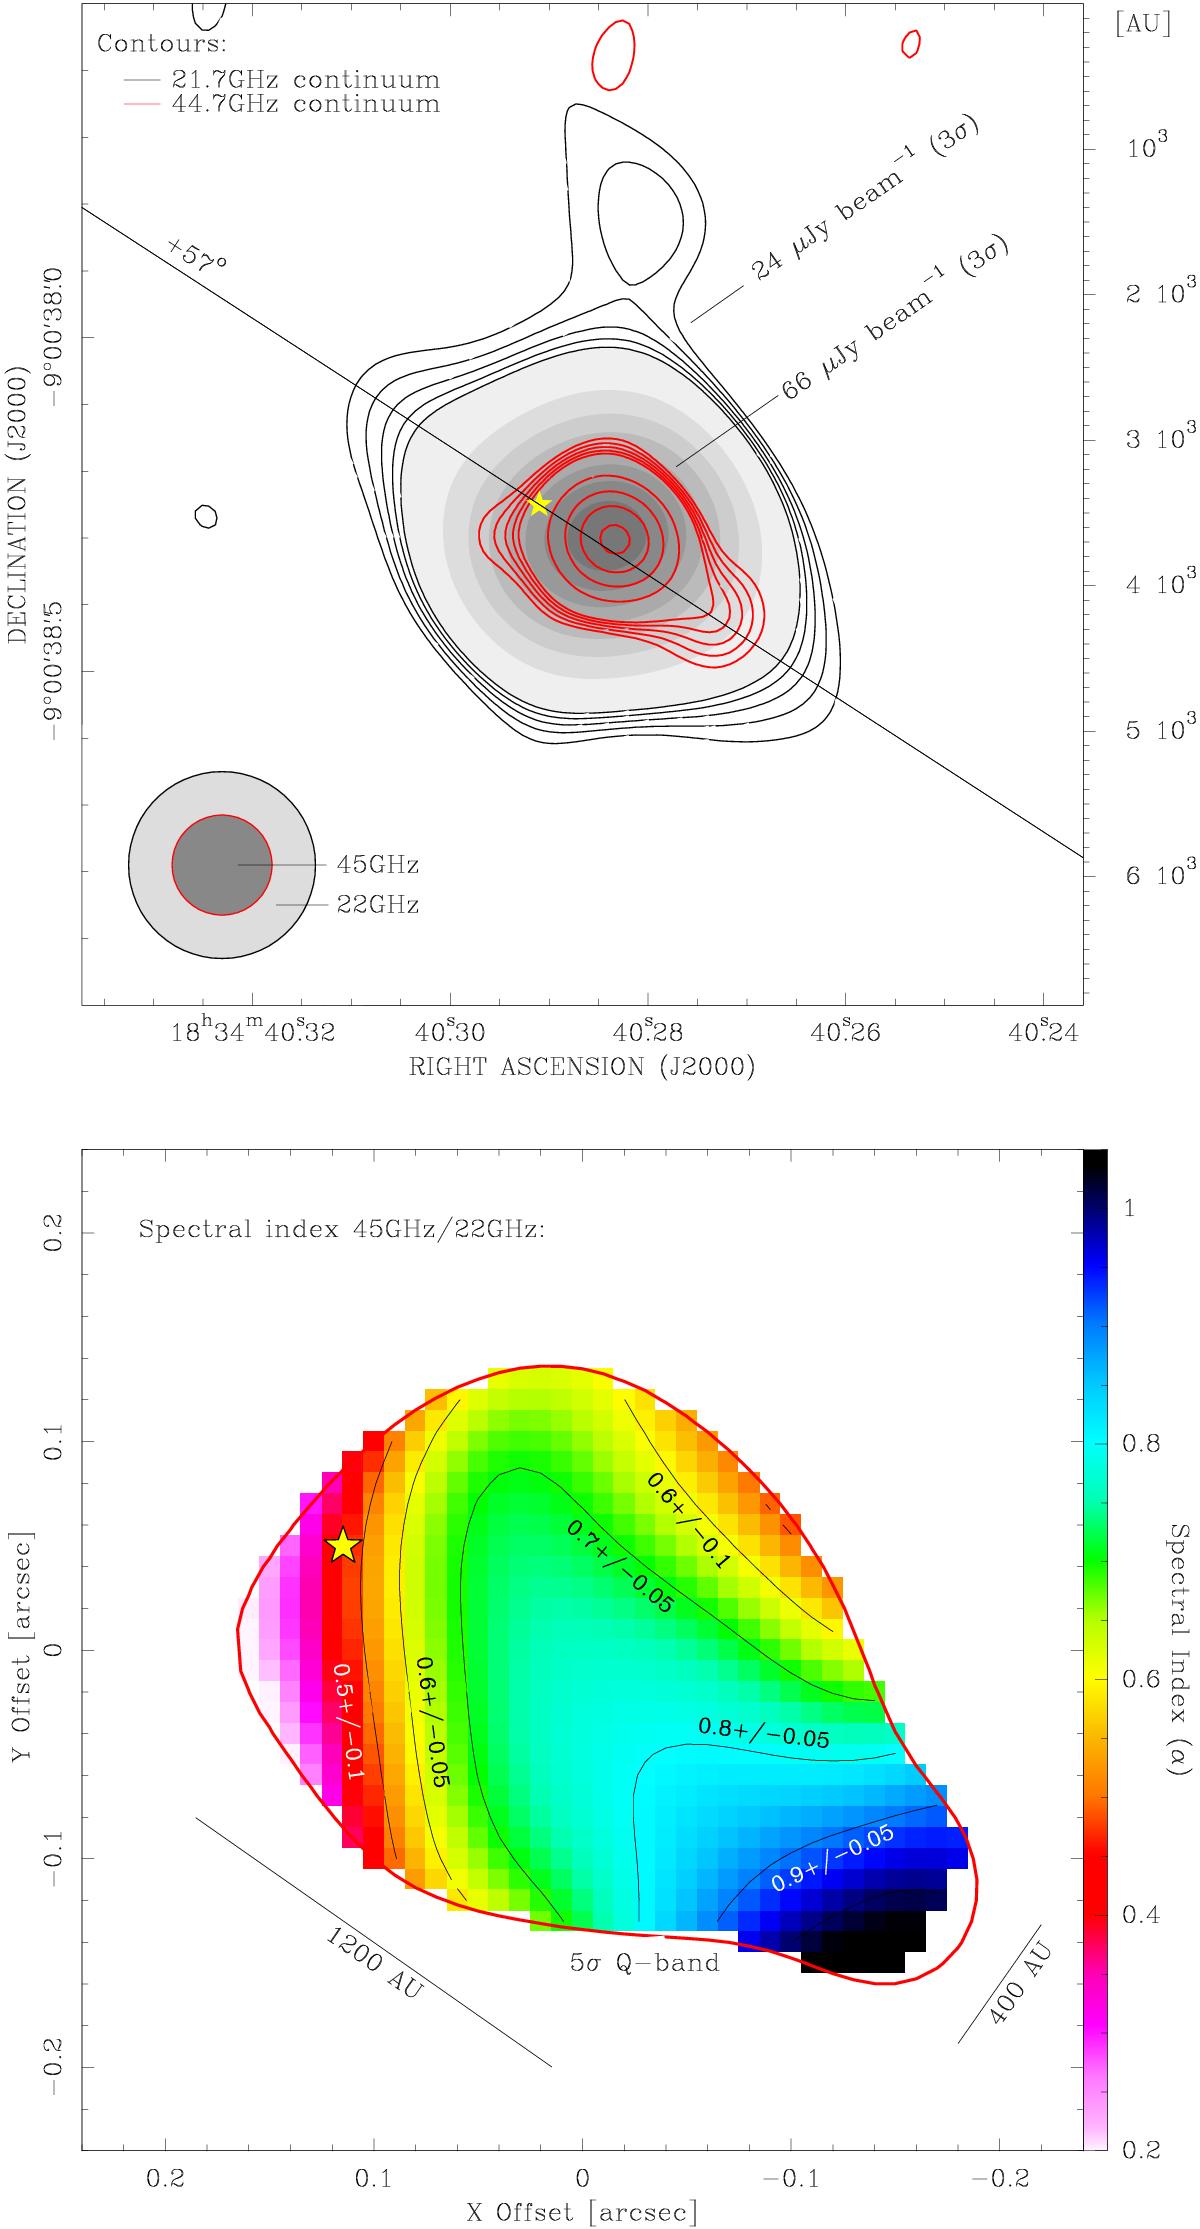
Radio continuum emission toward G023.01−00.41. Upper: overlay of the VLA maps at K (black contours and gray scale) and Q bands (red contours). The lower five contours start at 3σ (absolute value indicated) by 1σ steps. Higher intensity levels increase by 10σ steps starting from 7σ (drawn in gray scale at K band). HPBWs are shown at the bottom left corner. The right axis gives the linear extent of the map in AU. The star indicates the HMC center, which we assume to be the YSO position (same for the lower panel; see Sect. 3). The straight line, at a position angle of + 57°, shows the best fit to the elongation of the Q-band emission (see Sect. 3). Lower: map of the radio spectral index (colors) between the K- and Q-band emission, according to the right-hand wedge. Spectral index levels are drawn on the map (black contours) together with their formal uncertainty. The red thick contour shows the 5σ of the Q-band map. Linear scales for the extension of the spectral index map are indicated.
Current usage metrics show cumulative count of Article Views (full-text article views including HTML views, PDF and ePub downloads, according to the available data) and Abstracts Views on Vision4Press platform.
Data correspond to usage on the plateform after 2015. The current usage metrics is available 48-96 hours after online publication and is updated daily on week days.
Initial download of the metrics may take a while.