Fig. 5
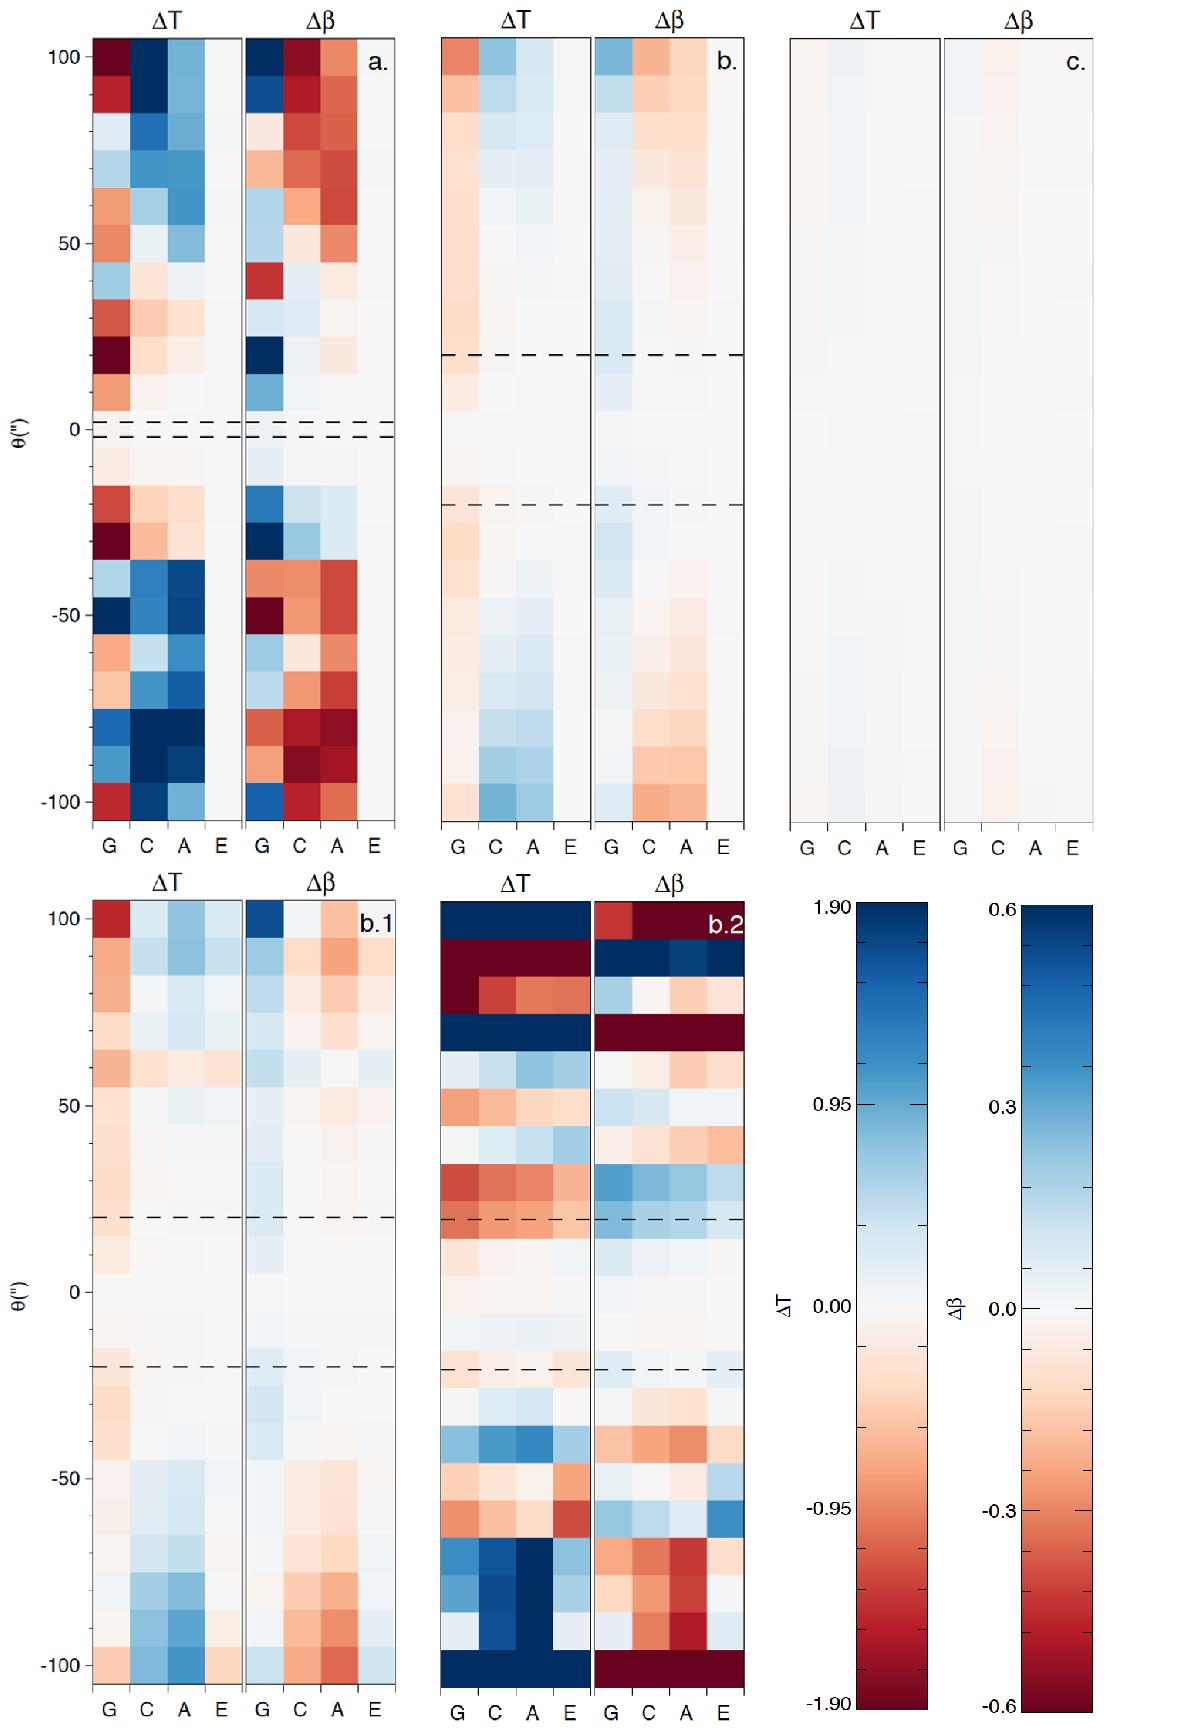
Heat maps of ΔT and Δβ measured on a simulated edge-on galaxy at various angular distances θ from the centre, as a function of the kernel type used. Each panel represents a scenario from Table 1. Dashed lines indicate the scale height of the dust profile zd. This figure highlights the very small scatter in both ΔT and Δβ when using the kernels with effective PSFs (column E on each plot, until the S/N becomes to low as in panel b.2).
Current usage metrics show cumulative count of Article Views (full-text article views including HTML views, PDF and ePub downloads, according to the available data) and Abstracts Views on Vision4Press platform.
Data correspond to usage on the plateform after 2015. The current usage metrics is available 48-96 hours after online publication and is updated daily on week days.
Initial download of the metrics may take a while.