Free Access
Fig. 9
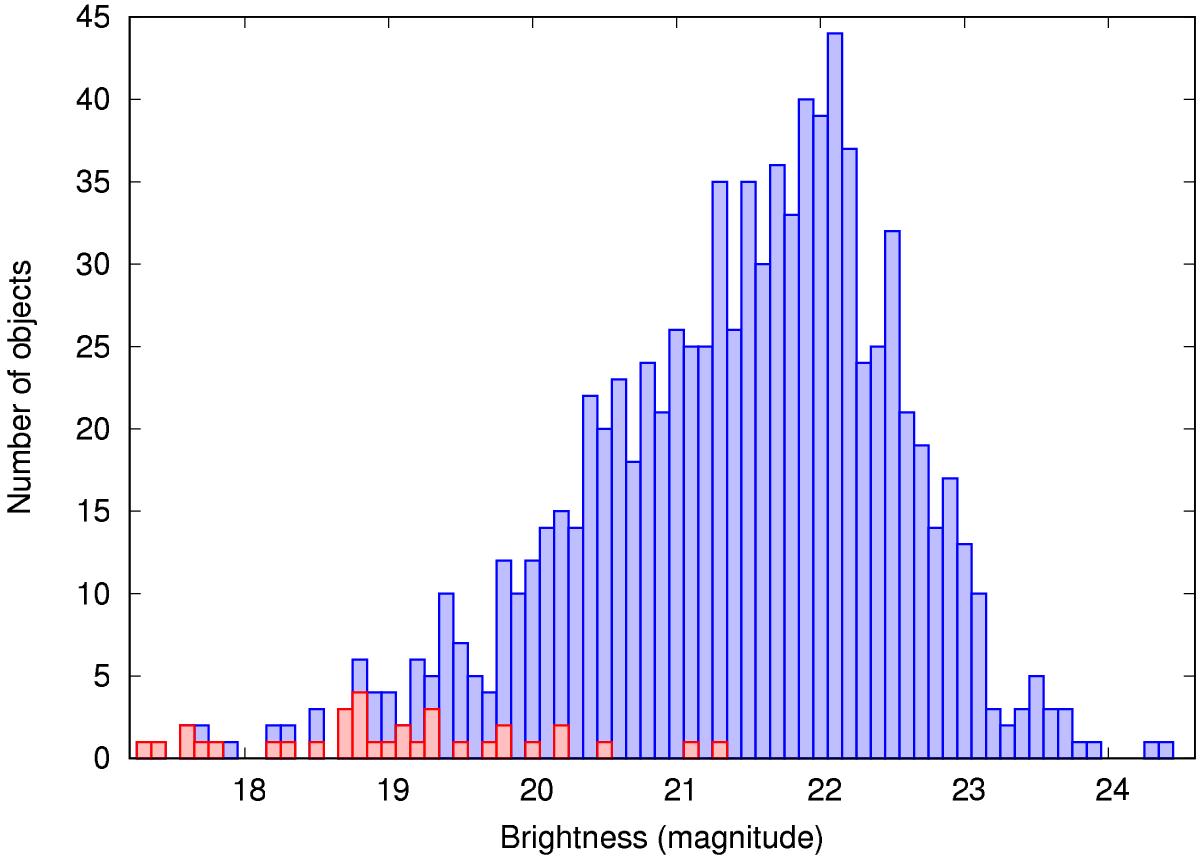
Magnitude distribution of the asteroids in the M35 field seen by Kepler (924, blue columns), and the selected sample where a significant rotational signal (period or trend) could be derived (35, red columns). Two brighter objects were omitted from the figure for the sake of clarity.
Current usage metrics show cumulative count of Article Views (full-text article views including HTML views, PDF and ePub downloads, according to the available data) and Abstracts Views on Vision4Press platform.
Data correspond to usage on the plateform after 2015. The current usage metrics is available 48-96 hours after online publication and is updated daily on week days.
Initial download of the metrics may take a while.