Free Access
Fig. 8
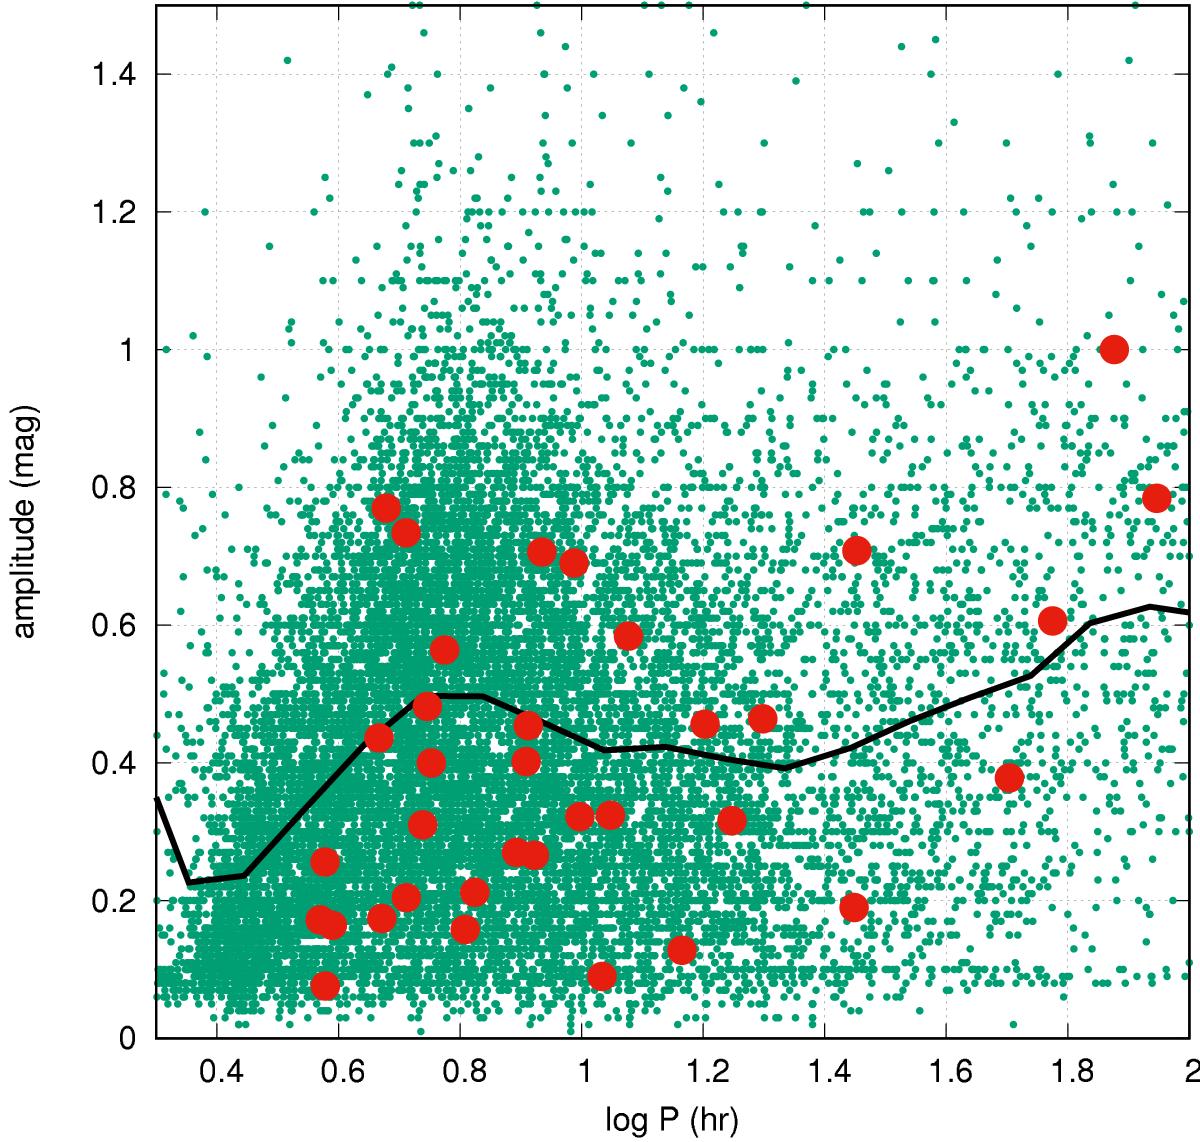
Period-amplitude diagram of an unbiased sample of 35 asteroids from the M35 field (red points). The small green dots represent 16 000 asteroids from the Asteroid Lightcurve Database (Warner et al. 2009), while the thick black line shows the binned average of that large sample.
Current usage metrics show cumulative count of Article Views (full-text article views including HTML views, PDF and ePub downloads, according to the available data) and Abstracts Views on Vision4Press platform.
Data correspond to usage on the plateform after 2015. The current usage metrics is available 48-96 hours after online publication and is updated daily on week days.
Initial download of the metrics may take a while.