Fig. 6
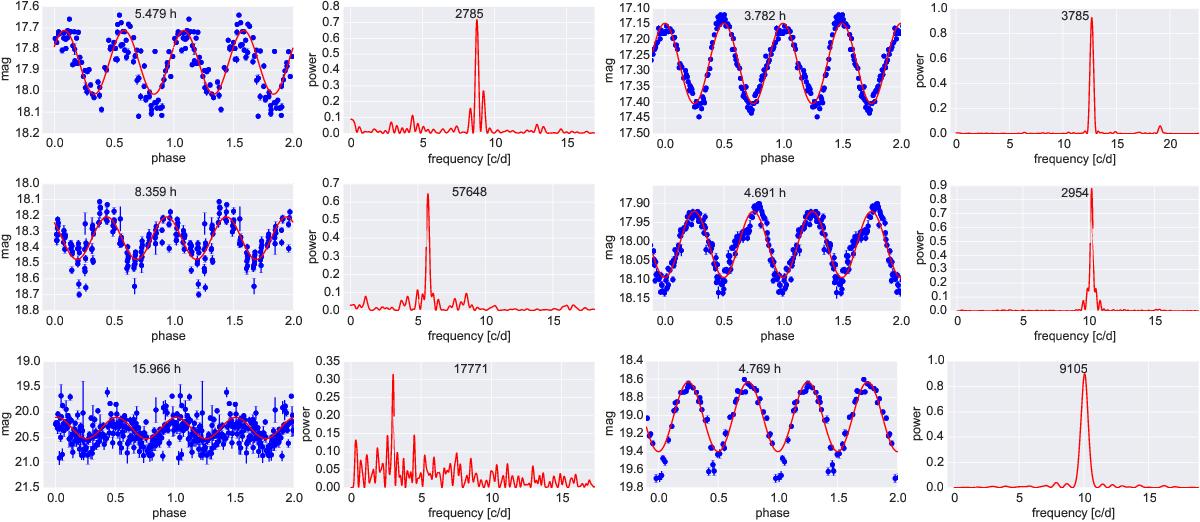
Examples of periodic long-cadence (29.4 min sampling) asteroid light curves ordered according to decreasing brightness. Left panels: asteroids crossing the M35 field, right panel: asteroids observed in the Neptune-Nereid path. In each case the left panel shows the K2 light curve with error bars folded by the adopted (double) period, the right panel is the Lomb-Scargle plot. The error bars for bright asteroids are smaller than the size of the symbols. The sine plotted in red is fit to the data to guide the eye. The adopted period and the ID of the asteroid is shown in the middle of the left and right panels, respectively.
Current usage metrics show cumulative count of Article Views (full-text article views including HTML views, PDF and ePub downloads, according to the available data) and Abstracts Views on Vision4Press platform.
Data correspond to usage on the plateform after 2015. The current usage metrics is available 48-96 hours after online publication and is updated daily on week days.
Initial download of the metrics may take a while.