| Issue |
A&A
Volume 596, December 2016
|
|
|---|---|---|
| Article Number | A82 | |
| Number of page(s) | 26 | |
| Section | Galactic structure, stellar clusters and populations | |
| DOI | https://doi.org/10.1051/0004-6361/201629029 | |
| Published online | 05 December 2016 | |
A Chandra X-ray study of the young star cluster NGC 6231: low-mass population and initial mass function⋆
INAF−Osservatorio Astronomico di Palermo G. S. Vaiana, Piazza del Parlamento 1, 90134 Palermo, Italy
e-mail: damiani@astropa.unipa.it
Received: 31 May 2016
Accepted: 26 July 2016
Context. NGC 6231 is a massive young star cluster, near the center of the Sco OB1 association. While its OB members are well studied, its low-mass population has received little attention. We present high-spatial resolution Chandra ACIS-I X-ray data, where we detect 1613 point X-ray sources.
Aims. Our main aim is to clarify global properties of NGC 6231 down to low masses through a detailed membership assessment, and to study the cluster stars’ spatial distribution, the origin of their X-ray emission, the cluster age and formation history, and initial mass function.
Methods. We use X-ray data, complemented by optical and IR data, to establish cluster membership. The spatial distribution of different stellar subgroups also provides highly significant constraints on cluster membership, as does the distribution of X-ray hardness. We perform spectral modelling of group-stacked X-ray source spectra.
Results. We find a large cluster population down to ~0.3 M⊙ (complete to ~1 M⊙), with minimal non-member contamination, with a definite age spread (1−8 Myr) for the low-mass PMS stars. We argue that low-mass cluster stars also constitute the majority of the few hundreds unidentified X-ray sources. We find mass segregation for the most massive stars. The fraction of circumstellar-disk bearing members is found to be ~5%. Photoevaporation of disks under the action of massive stars is suggested by the spatial distribution of the IR-excess stars. We also find strong Hα emission in 9% of cluster PMS stars. The dependence of X-ray properties on mass, stellar structure, and age agrees with extrapolations based on other young clusters. The cluster initial mass function, computed over ~2 dex in mass, has a slope Γ ~ −1.14. The total mass of cluster members above 1 M⊙ is 2.28 × 10³M⊙, and the inferred total mass is 4.38 × 10³M⊙. We also study the peculiar, hard X-ray spectrum of the Wolf-Rayet star WR 79.
Key words: stars: pre-main sequence / open clusters and associations: individual: NGC 6231 / stars: coronae / stars: luminosity function, mass function / X-rays: stars
Full Tables B.1 and B.2 are only available at the CDS via anonymous ftp to cdsarc.u-strasbg.fr (130.79.128.5) or via http://cdsarc.u-strasbg.fr/viz-bin/qcat?J/A+A/596/A82
© ESO, 2016
1. Introduction
Massive stars in OB associations are easily identified as bright blue stars against fainter and redder background field stars, and being bright and observable up to large distances have been intensively studied over decades. The low-mass stars born in the same associations, however, have received much less attention in the past, because they are much fainter and difficult to discern from faint field stars. This is especially true if the OB association lies far away, low on the Galactic plane. The advent of X-ray observations has provided an invaluable tool to find young low-mass stars, which are orders of magnitude brighter in X-rays than older field stars of the same mass and spectral types. Moreover, the sensitivity and spatial resolution of X-ray data available today from the Chandra X-ray observatory has permitted to extend these studies to the many regions farther than 1 kpc, previously unaccessible (due to insufficient sensitivity and strong source confusion) to earlier-generation X-ray observatories such as ROSAT, thus enlarging enormously the sample of regions accessible for such detailed studies across almost the entire mass spectrum.
We have studied in X-rays with Chandra the young cluster NGC 6231, part of the Sco OB1 association, containing more than 100 OB stars (and one Wolf-Rayet star), with the purpose of studying its population, complete down to approximately one solar mass. These data show the existence of a very large low-mass star population in this cluster. We are therefore able to study in detail its spatial distribution, the cluster locus on the color−magnitude diagram and cluster age, the percentage of stars with T Tauri-like properties, and the cluster initial mass function (IMF).
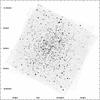 |
Fig. 1 Combined Chandra ACIS-I image of NGC 6231, slightly smoothed to emphasize point sources. The field of view of each ACIS-I pointing is 16.9′ × 16.9′, corresponding to 7.81 pc at the cluster distance. Coordinates are equatorial (J2000). |
NGC 6231 was already observed in X-rays with XMM-Newton (Sana et al. 2006a), with the detection of 610 X-ray sources; X-ray emitting OB stars were studied by Sana et al. (2006b), and the lower-mass X-ray sources by Sana et al. (2007). Despite these XMM-Newton data being potentially deeper than ours (total exposure 180 ks, with larger instrument effective area), and over a wider field, they are severely background- and confusion-limited, and their source catalog contains much less than one-half sources than the new X-ray source catalog we present in this paper.
An extensive survey of the published literature on NGC 6231 was made by Sana et al. (2006a), mainly optical photometric and spectroscopic studies of cluster membership, distance, radial velocities, variability and binarity, with main emphasis on massive stars. Until not long ago, optical photometric studies extending to low-mass stars were few, with limited spatial coverage or relatively shallow limiting magnitude (Sung et al. 1998, hereafter SBL; Baume et al. 1999). More recently, several of these limitations were overcome by the work of Sung et al. (2013a; SSB), who made deep (about V< 21), wide-field UBVI and Hα photometry in the NGC 6231 region. Moreover, the cluster has data in the VPHAS+ DR2 catalog (Drew et al. 2014) including ugri and Hα magnitudes, down to a depth comparable to SSB. There is a remarkably large fraction of binaries among massive stars, as found by Raboud (1996), García & Mermilliod (2001), and Sana et al. (2008). SSB derive a distance modulus for NGC 6231 of 11.0 (1585 pc), a reddening E(B−V) = 0.47, and a nearly normal reddening law with R = 3.2. We adopt these values for the present work.
This paper is structured as follows: Sect. 2 presents our Chandra data on NGC 6231 and the source detection procedure; the X-ray source cluster morphology is studied in Sect. 3; Sect. 4 describes the identification of detected sources with the available optical and near-IR catalogues; in Sect. 5 we examine the properties of the X-ray selected cluster population using color−magnitude and color-color diagrams; spatial distributions of subgroups of candidate members are studied in Sect. 6; low-resolution ACIS X-ray spectra are studied in Sect. 7, and X-rays from massive OB stars are studied in Sect. 8; eventually, the dependence of X-ray emission on stellar properties is studied in Sect. 9, and compared to other young clusters within an evolutionary framework; a detailed cluster IMF is computed in Sect. 10 and finally, we summarize our findings in Sect. 11. An appendix is devoted to the spatial distribution of reddening.
2. The Chandra X-ray observations and source detection
NGC 6231 was observed twice in X-rays with the ACIS-I detector onboard the Chandra X-ray Observatory on 2005, July 3−4 (ObsId 5372) and 16−17 (ObsID 6291), respectively. The two pointings share the same center (aimpoint) but were performed with a different roll angle. Effective exposure times were 76.19 and 44.39 ks, respectively, so that the total exposure time was 120.58 ks. The combined, deep image of NGC 6231 is shown in Fig. 1, where it is clear how crucial is the high spatial resolution of Chandra (on-axis PSF FWHM ~ 0.5′′) to resolve the very crowded cluster population.
The data were filtered to retain the energy band 0.3−8.0 keV, and the full-field lightcurves were inspected to search for high-background periods, but none were found. Exposure maps were computed using standard CIAO software tasks. To these prepared datasets, we applied the source detection software PWDetect, a wavelet-based detection algorithm developed at INAF-Osservatorio Astronomico di Palermo1, already used with success in the analysis of crowded star clusters (e.g., NGC 6530, Damiani et al. 2004; the COUP data on the Orion Nebula Cluster (ONC), Getman et al. 2005; NGC 2362, Damiani et al. 2006a). This algorithm is based on its earlier ROSAT version wdetect (Damiani et al. 1997a, b). The PWDetect version used here is a modified one, able to detect sources in combined datasets, thus taking fully advantage of the deep total exposure (this version was already used to analyze the even more varied set of Chandra data on the open cluster NGC 2516, Damiani et al. 2003, and the COUP data). The detection threshold was chosen such as to yield ten spurious detections in the field of view (FOV), for the given background counts. This is a more relaxed constraint than the more usual limit of one spurious detection per field, but is justified when the lowered threshold allows the detection of more than one hundred additional faint sources, as it was the case here or in the COUP Orion data.
Since the two pointings have different roll angles, a few sources were falling in one but not in the other (Fig. 1), and they were also included in the final source list. Overall, we detect 1613 individual X-ray sources, listed in Table B.1.
3. Cluster size and morphology
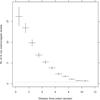 |
Fig. 2 Surface density of X-ray sources detected in the ACIS FOV, with more than 20 X-ray counts. The dotted horizontal line is the average surface density of a reference galactic-plane field with nearly the same exposure time as the NGC 6231 field. |
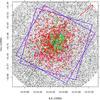 |
Fig. 3 Spatial distribution of all detected X-ray sources (crosses), and of stars from the SSB optical catalogue (dots) within 15′ of cluster center. The two tilted blue squares are the two ACIS-I FOVs. The dashed line running almost diagonally throughout the figure is the cluster symmetry axis obtained from our principal-component analysis. The Galactic Plane direction is here approximately towards South-East. The big red arrow at top right indicates galactic North. Color codes for X-ray detected sources (crosses) are: blue for OB stars, cyan for A−F (including some B-type) stars, red for low-mass pre-main-sequence stars, purple for field MS stars, magenta for foreground stars, and green for optically unidentified sources. |
The very large number of X-ray sources in the Chandra image, compared to the average galactic-plane field, and their clustered distribution, strongly suggest that most X-ray sources are indeed cluster members. Very young stars are known to emit copious X-rays, with X-ray luminosities typically 103−104 times higher than (older) field stars. X-ray detection is therefore an important, if not conclusive, membership criterion, which we will use in combination with the optical and infrared data for these stars to find a list of good candidate members of the cluster.
The cluster has (almost) a circular symmetry, and we have studied its radial profile by counting detected sources in annuli, centered on the median position of all X-ray sources: (α,δ) = (16:54:14.4, –41:49:54.8). We consider only detections with more than 20 counts, that is detectable across the whole FOV, to be free from off-axis dependent sensitivity effects (mainly due to the strongly varying PSF). The cluster profile is shown in Fig. 2: the source density falls down by a factor of 2 within 3 arcmin (1.39 pc) from center, and becomes compatible with an average Galactic-plane value beyond 9−10 arcmin. This characteristic radius is 48% larger than the corresponding radius of NGC 2362, determined with exactly the same method and above nearly the same count-rate threshold (Damiani et al. 2006a).
To estimate an appropriate Galactic-plane X-ray source density above the same threshold, in the direction of NGC 6231, we have selected from the Chandra archive a reference pointing on the Galactic plane, purposely free from extended sources or star clusters, and as close as possible in angular distance from galactic-center, and exposure time, to our pointings. One such dataset is ObsId 2298 (PI: K. Ebisawa), with exposure 98.7 ks, at galactic coordinates (l,b) = (28.56,−0.02) (NGC 6231 lies at (343.46,1.17)). The source density above 18 counts (i.e. 20 counts scaled to the exposure-time ratio) is also shown in Fig. 2. This galactic plane density value is only approximately appropriate, since it depends strongly on the actual pointing direction, and decreases with distance from the Galactic Center and Galactic Plane (which are not the same for NGC 6231 and the reference field). A corresponding reference field for NGC 2362 showed a distinctly lower source density than ObsId 2298 (see Damiani et al. 2006a).
Upon close inspection, the distribution of X-ray sources in NGC 6231 is not exactly circular, but slightly elongated. We applied a principal-component analysis to source positions (limited to off-axis less than 7 arcmin, to be unaffected by the square ACIS-I shape), and found a symmetry axis inclined by 35 degrees from North (Fig. 3), namely approximately normal to the Galactic Plane. The rms distances of sources from cluster center along and across such axis differ by 15%. There is however no apparent dependence of stellar properties on this elongated morphology: ages and masses (to be studied below) are distributed identically on opposite sides along the symmetry axis. This elongation might be related to the origin of the cluster itself: Rees & Cudworth (2003) suggested that the passage through the galactic disk of the globular cluster NGC 6397 might have triggered formation of NGC 6231.
4. Optical and IR identifications of X-ray sources
We have identified our X-ray detections with stars in the SSB catalog, in the VPHAS+ catalog, and the 2MASS catalog. Each of these catalogues covers fully our combined X-ray FOV. Source identification was first made with 2MASS (as astrometric reference), using individual position errors computed by PWDetect for X-ray detections and catalogued values for 2MASS sources. Following the 2MASS Explanatory Supplement (Cutri et al. 2003), we considered only 2MASS sources unaffected by strong photometric uncertainties, and discarded those with flagsph_qual = “E”,“F”,“U” or“X”, or withcc_flg = “p”,“d” or“s”. Matches were accepted within a distance of 4σ times the combined position uncertainty. In this way we found and corrected a systematic shift between X-ray- and 2MASS positions, of 0.08′′ in RA, and 0.12′′ in Declination. After accounting for these corrections, we find 1087 2MASS identifications for our X-ray sources. Among them, the estimated number of spurious identifications is 126.
We proceeded in an analogous way in matching X-ray sources with the VPHAS+ and SSB catalogues. VPHAS+ identifications are 1164, while SSB yielded 1081 identifications. We made some sub-arcsecond adjustments to the SSB positions, using second-degree polynomials in RA and Dec, since the SSB positions exhibited non-random, position dependent offsets with respect to X-ray positions; the same effect was evidently absent using VPHAS+ and 2MASS positions. The estimated numbers of spurious X-ray identifications are 90 for VPHAS+ stars and 83 for SSB stars. The three catalogues, although spatially complete across our X-ray FOV, have each its own incompleteness, so that the overlap of the three identification lists is not complete (nor is any of the lists simply a subset of any other list). There are 161 SSB X-ray identifications without a VPHAS+ counterpart, and 151 without a 2MASS counterpart. This is due mostly to incompleteness of the latter two catalogues at the bright end: NGC 6231 is a rich cluster, with its brightest stars having V ~ 5, or 15−16 mag above the faint limit of those catalogues. On the other hand, we have checked that the SSB catalogue depth is not uniform across the FOV: the southwest quadrant is ~1.5 mag shallower than the rest of the region. As a result, 249 X-ray sources with a VPHAS+ identification have no counterpart in the SSB catalogue, and 226 have also no counterpart in 2MASS. Finally, among the 2MASS identifications of X-ray sources, 179 have no VPHAS+ counterpart, and another 179 have no SSB counterpart. Overall, the number of X-ray sources with at least a counterpart in any of the optical or 2MASS catalogues is 1374; only 239 X-ray sources remained without any identification. Results from this identification procedure are given in Table B.2.
5. Color−magnitude and color−color diagrams
5.1. Stellar groups
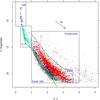 |
Fig. 4 (V,V−I) color−magnitude diagram of all optical stars in the NGC 6231 ACIS FOV. Crosses are X-ray sources, with color codes as in Fig. 3, while dots are X-ray undetected stars. The solid green line is the Siess et al. (2000) ZAMS using the Kenyon & Hartmann (1995; KH95) color transformation, at the cluster distance and reddening. The black polygons are used to define stellar groups, as labeled. The cluster extinction vector is also shown. |
In Fig. 4 we present a (V,V−I) color−magnitude diagram (CMD), of both X-ray detected and undetected stars in the ACIS FOV, using the SSB photometry. The Siess et al. (2000) zero-age main sequence (ZAMS) reproduces approximately the lower envelope of field-star datapoints. Very conspicuous is the lack of faint blue stars below it, which indicates a rapid rise of extinction with distance. In the case of an extinction “wall”, as is the case behind the cluster NGC 6530 (Prisinzano et al. 2005), the ZAMS shape describes accurately the lower envelope of field-star datapoints in the CMD. The characteristics ZAMS shape becomes instead unrecognizable when extinction increases more slowly with distance. In the case of NGC 6231 the agreement between the ZAMS shape and observed datapoints is limited, so we cannot unambiguously determine the presence of an extinction wall just behind the cluster. Nevertheless, evidence for a sharp extinction rise somewhere behind the cluster and its neighborhood, based on IR color distributions, is discussed in Appendix A.
From the CMD in Fig. 4, it is clear that the majority of X-ray sources consist of many tens of bright stars on the ZAMS, and hundreds stars in a 2−3 mag wide band above the low-mass main sequence (MS) at V−I> 1, which is natural to identify as the cluster pre-main-sequence (PMS) band, as also found by Sana et al. (2007). Accordingly, we define five main star groups from their position in the CMD of Fig. 4, as indicated: the OB (main-sequence or evolved) stars, the A−F stars which have just arrived on the main sequence (or are about to arrive), the PMS stars making the bulk of the X-ray detections, and Field-MS (Foreground) stars as X-ray detections distinctly below (above) the PMS band. At the bright end, several stars in the SSB catalogue lack a V−I color value but have a B−V value; we included these latter in the OB group if B−V< 0.65 and V< 11. The upper main sequence of NGC 6231 is better shown in the (V,B−V) CMD of Fig. 5, where only stars brighter than V = 14) are included, with their spectral types indicated (when available from SIMBAD). All stars brighter than V ~ 9.3 are detected in X-rays, including 4 OB supergiants and the Wolf-Rayet star HD 152270 (WR 79, X-ray #1008). Spectral types of stars fainter than V ~ 12 are increasingly rare, so there is little detailed information available for individual stars in NGC 6231.
At the faint end of the complete CMD, the grouping based on the SSB catalogue was complemented with the VPHAS+ catalogue, using the (r,r−i) CMD shown in Fig. 6. A sixth group is also defined, which comprises all X-ray sources not identified with an optical star. Overall we classify 31 X-ray sources in the OB group, 95 in the A−F group, 1035 in the PMS group, 80 in the Field-MS group, 18 in the foreground, and 354 as optically unidentified. The nature of these latter X-ray sources, and the completeness of our X-ray catalogue at the lowest masses is discussed below.
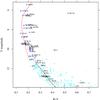 |
Fig. 5 (V,B−V) color−magnitude diagram of bright stars in NGC 6231. Symbols are as in Fig. 4. When available from SIMBAD, spectral types are indicated. The black line is the KH95 ZAMS, while the red line is a 3 Myr isochrone from Ekström et al. (2012). |
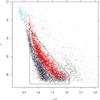 |
Fig. 6 VPHAS+(r,r−i) CMD. Symbols as in Fig. 3. The adopted definition of additional VPHAS+ stars in the PMS and Field-MS groups is indicated by the polygons. |
We use the (U−B,B−V) optical color−color diagram of Fig. 7 to estimate whether there is a different extinction affecting massive and low-mass stars, and whether stars with strong UV excesses are present in the cluster (as is typical of e.g. strongly accreting T Tauri stars). It turns out that the same average reddening value describes well nearly all X-ray detected stars, with most of the exceptions having large photometric errors. While a definite spread, exceeding photometric errors, exists for massive stars (in agreement with SSB), the spread for low-mass stars can be accounted for by the photometric errors. In any case, the fact that the average reddening is the same for all stars implies that its nature is interstellar (foreground), not circumstellar. Moreover, there is no conclusive evidence of UV excesses in a significant number of cluster stars, including those showing Hα emission or IR excesses, to be defined below, which are diagnostics of accretion and circumstellar disks in PMS cluster members.
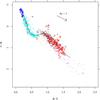 |
Fig. 7 (U−B,B−V) color−color diagram for NGC 6231. Symbols are as in Fig. 4. Orange triangles indicate IR-excess stars, and brown circles Hα-excess stars, see below. |
5.2. Cluster age and age spread
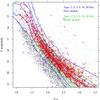 |
Fig. 8 PMS band of the cluster CMD with superimposed BHAC and Siess et al. (2000) isochrones of different ages, as labeled. Symbols as in Fig. 4. |
We have compared the positions of the PMS cluster members in the CMD with available model isochrones. The set of models by Baraffe et al. (2015; BHAC), shown in Fig. 8, describe well the observed cluster locus, with inferred ages and spread independent of mass. The BHAC models are limited to stars with M< 1.4 M⊙. Therefore, we have also considered the older Siess et al. (2000) isochrones, also shown in Fig. 8, which perform less well in the same mass range (with color-depending inferred ages for our stars). We have therefore adopted preferentially the BHAC isochrones as reference, and the Siess et al. ones only for M> 1.4 M⊙. With these choices, the bulk of cluster PMS stars fall in the age range 1−8 Myr, in good agreement with the ages found by SSB (4−7 Myr for the massive stars, 1−7 Myr for low-mass PMS stars).
We have studied if the spread in the PMS band of NGC 6231 is significant with respect to errors, and the age spread this might imply. To better quantify such a spread, V magnitude differences were computed with respect to the BHAC 5-Myr isochrone, but this yielded color-dependent residuals when examined in detail. Therefore, we proceeded by using an empirical running-mean fit to the PMS cluster stars, which yielded color-independent residuals ΔV, as shown in Fig. 9. In the same figure we show the (color-dependent) averages of total error on ΔV, computed as 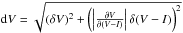 , where δV and δ(V−I) are the photometric errors given by SSB. This formulation is necessary since even if (hypothetically) the V magnitude error δV were equal to zero, the V−I error would still produce a broadened sequence, and therefore a spread in V, to an amount proportional to the local slope of the cluster sequence, here being
  . Figure 9 shows that, except for the reddest cluster stars, total errors on ΔV are much smaller than the observed spread, which is therefore real, and attributable to an age spread but also to some extent to binaries.
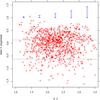 |
Fig. 9 V magnitude residuals ΔV vs. V−I color, for X-ray detected PMS cluster stars (red crosses). Also shown are the average total errors on ΔV, for comparison (blue segments). |
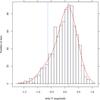 |
Fig. 10 Distribution of ΔV for cluster PMS stars. The best-fit model is shown in red. Dashed blue lines indicate the centers of the best-fit Gaussians. |
A histogram showing the distribution of ΔV is shown in Fig. 10. It is clear that the distribution is asymmetrical, with a more extended tail at negative values. This might be due to the time-varying star-formation rate in the cluster, in the absence of binaries. However, postulating the absence of binaries is highly unlikely (especially since a large binary fraction of at least 68% was found for massive stars by Sana et al. 2008). A low-mass binary sequence is found in the 5 Myr old cluster NGC 2362 by Moitinho et al. (2001), thanks to its exceptionally clear CMD. We have therefore modeled the ΔV distribution using two Gaussians (for single and binary stars respectively), with the same width σ, separated by a fixed interval of 0.752 mag, and independent normalizations. The best-fit model, also shown in the figure, reproduces well the observed histogram: its parameters are σ = 0.33 mag, and normalization ratio 0.235 (number of binaries/number of singles). Such binary fraction is much lower than that of massive stars, but it must be remarked that it refers to (near) equal-mass binaries only, so it is actually a lower limit. The 0.33 mag net spread on ΔV (still much larger than errors on ΔV, as derived above) is instead attributed to intrinsic age spread among the cluster PMS stars. Compared to the BHAC isochrones, this amounts to approximately a factor of two on either direction (1σ) from median, so that the bulk of PMS stars is derived to have ages in the range 1.5−7 Myr.
5.3. Hα emission stars
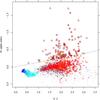 |
Fig. 11 Hα index from SSB vs. V−I color. Orange triangles indicate IR-excess stars (see below), and brown circles Hα-excess stars; other symbols as in Fig. 4. The dashed line is our nominal limit to separate CTTS (above it) from WTTS and other non-emission stars. |
SBL tried to find low-mass NGC 6231 stars on the basis of their enhanced Hα emission, typical of T Tauri stars, but found only a relatively small number of stars, with an inferred low-mass depleted IMF. This was later rectified by the work of SSB, who found a much richer low-mass population. The Hα photometry presented by SBL, and to a deeper limiting magnitude by SSB, keeps its value as a tool to study the fraction of PMS cluster stars showing classical T Tauri star (CTTS) characteristics, as opposed to PMS stars exhibiting only weak emission lines (weak-line T Tauri stars − WTTS). Moreover, some CTTS with thick circumstellar envelopes might remain undetected in X-rays, so that a strong Hα emission complements X-rays as a cluster membership indicator. The selection of CTTS using the SSB photometric data is conveniently done (as these authors already did) using a diagram of their Hα index vs. V−I color, which we reproduce in Fig. 11 with the addition of our X-ray detections. We have set the CTTS selection threshold in this diagram in a more conservative way than SSB. As just mentioned, not all CTTS selected using this diagram are X-ray sources.
A useful complement to the SSB photometry is the VPHAS+ photometry, also including an Hα emission index r−Hα. A diagram showing this index vs. color r−i (also from VPHAS+) is in Fig. 12. The nominal separation between CTTS and non-emission stars shown in the figure is taken from Kalari et al. (2015). Therefore, we have defined CTTS in NGC 6231 as the union of the CTTS samples derived from SSB and VPHAS+ catalogues (203 stars in the ACIS FOV, of which 98 in the PMS locus). The total number of PMS stars (either X-ray or Hα-selected) becomes 1075, and the CTTS-to-total number ratio is 9.1%. Most of the Hα-selected stars falling outside the cluster PMS band lie in the Field-MS band (101 stars), which is a somewhat surprisingly large number of stars for a sample of foreground main-sequence field stars. There is still the possibility that some (maybe most) of these near-MS Hα-excess stars are true PMS NGC 6231 members, with peculiar optical colors making them appear bluer, or at lower luminosity, than the bulk of cluster PMS stars. An analogous situation was described by Damiani et al. (2006b) in NGC 6530 and Guarcello et al. (2010a) in NGC 6611, and cannot be discarded here. If the near-MS Hα-emission stars in NGC 6231 are PMS members, their X-ray detection rate (7/101 stars) is remarkably low, compared to the X-ray detection rate of Hα-emission stars in the PMS band (58/98 stars). Also in NGC 2264 several Hα-emitting candidate members are found near or even below the MS, and typically lack X-ray emission, perhaps because of absorption by a nearly edge-on disk (Sung et al. 2004). However, since we lack for the moment a definite indication that the near-MS Hα-emission stars are indeed members, we conservatively exclude them from further considerations in the following.
Also worth consideration is a diagram of V magnitude vs. index Hα (from SSB; Fig. 13). Besides the Hα-excess stars already selected, this diagram shows a discontinuity in the distribution of X-ray sources around V = 14, which is not found in other clusters (see e.g. the analogous diagram for NGC 6530, Fig. 14 in Damiani et al. 2004). By comparison with the (V,V−I) diagram, we see that near V = 14 we find the bulk of A stars just settled on the main sequence, after crossing in a relatively short time the diagram horizontally. Because of this, in Fig. 13 near V = 14 a color gap separates a rich group of A stars (with deep Hα absorption lines, and lowest values of Hα index), from G stars with weak (photospheric) Hα lines. At younger ages (e.g. 2−3 Myr as NGC 6530) A-type stars have not yet arrived on the main-sequence, but are found, in a smaller number, on their PMS radiative tracks, during a rapid transition to become main-sequence B stars. Therefore, a diagram like that of Fig. 13 can be another useful age indicator for a cluster, where the Hα index discontinuity increases with age from 2 to 10 Myr. This allows us to trust more confidently the NGC 6231 isochronal age derived above.
5.4. IR diagrams
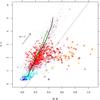 |
Fig. 14 Mixed optical-IR (V−I,H−K) color−color diagram. Symbols are as in Fig. 4. The black (green) solid line is a 5 Myr Siess (BHAC) isochrone for mass M> 0.1 M⊙, the dashed line is our adopted limit to select IR-excess stars. Symbols as in Fig. 11. |
The 2MASS photometry provides us with additional useful information on the studied stars. We first consider mixed optical-IR color−color diagrams, such as the (V−I,H−K) diagram of Fig. 14. The usefulness of this type of diagrams for selecting stars with near-IR excesses was previously demonstrated in our study of the massive young cluster NGC 6530 (Damiani et al. 2006b): many IR-excess stars can be found from these mixed diagrams, which are not selected as such from the usual (J−H,H−K) diagram, because their IR colors alone mimic a reddened photosphere. The bulk of cluster and field stars in Fig. 14 lie at positions consistent with normal photospheric colors; to the right of the dashed line, the H−K color is too red, however, for a normal reddened photosphere, and there is an excess emission in the K band, probably because of the presence on a circumstellar dust disk. Tens of X-ray detected stars in the PMS band (in the optical CMD) also fall in this part of the diagram, consistent with their being CTTS; several of them are also Hα-excess stars. Some care must be used, however, before claiming that these stars do really possess an IR excess (and a dusty disk) because of their placement in this diagram, because such a mixed representation is obtained by matching two large catalogues, and spurious matches would easily produce “stars” with strange colors. We have therefore evaluated the number of spurious matches using the method explained in Damiani et al. (2006b), most appropriate when two matched catalogues contain an expected large number of truly common objects, like here. The result is a predicted number of 8.5 spurious matches in the ACIS FOV, between 2MASS and the SSB catalogue, or 0.23% of total 2MASS-SSB matches in the ACIS FOV (3685). This number is much smaller than the number of stars to the right of the dashed line in Fig. 14, and therefore most of these latter must be true IR-excess stars. However, we may take a step further, by considering the match between the VPHAS+ and 2MASS catalogues. Although the SSB and VPHAS+ photometry have most stars in common, they are statistically independent datasets, with independent errors: therefore, spurious matches between SSB and 2MASS will not generally coincide with those between VPHAS+ and 2MASS. By matching these two latter catalogues, we obtain the (r−i,H−K) diagram of Fig. 15, which again shows a large number of candidate IR-excess stars, with an estimated number of 16.7 spurious matches (0.38% of all 4441 matches in the FOV). If the two set of matches were completely independent, the joint probability that an optical-2MASS match is spurious in both the SSB and VPHAS+ cases is 0.0023 × 0.0038 = 8.74 × 10⁻⁶, that is much less than one star in the whole dataset; in reality, some covariance can be expected so this estimate is excessively optimistic. Nevertheless, the intersection between the candidate IR-excess stars found in Figs. 14 and 15 may be considered as a high-confidence IR-excess star sample (only these high-confidence stars are indicated with orange triangles in the figures). Disregarding errors on the optical and IR colors, their number would be 163 stars. Taking instead a more conservative limit of a 3σ minimum distance from the fiducial limit, this number reduces to 48 IR-excess stars, which we adopt here as the most reliable sample. Had we taken the union of the two IR-excess samples, their number would have been of 79 stars. Only 7 of the high-confidence IR-excess stars are also Hα-emission stars. We will examine the membership status of the IR-excess stars below.
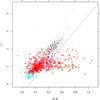 |
Fig. 15 Optical-IR (r−i,H−K) color−color diagram using VPHAS+ colors. Symbols are as in Fig. 4. The dashed line is our adopted limit to select IR-excess stars (orange triangles). Symbols as in Fig. 11. |
In the most favorable case of 100% membership, the number of IR-excess stars would imply a circumstellar disk frequency of 4.6% for NGC 6231 PMS stars (becoming 15.7% if the IR-excess star selection is performed less conservatively, as often made). This percentage is much smaller than that found in clusters like the ONC (where almost all stars are found to have disks), but compares well to other high-mass clusters such as NGC 2362 (1500 pc, age 5 Myr), where different studies converged to an estimated disk percentage of ~10% (Haisch et al. 2001; Damiani et al. 2006a).
Figure 16 is a (J,J−H) CMD for all 2MASS sources in the ACIS FOV. The X-ray selected stars follow well the Siess and BHAC 5-Myr isochrones (the scatter being too large to enable discrimination between the two). The X-ray undetected field stars appear to split in two main groups: one at nearly the same J−H colors as the cluster, and a much redder one at J−H ~ 1.5−2. Appendix A discusses the IR color distribution of field stars in more detail. Almost all the Hα-emission stars selected above fall in the low-extinction group. About one-half of the IR-excess stars defined above lie at low extinction, while the other half are found in the high-extinction group, probably because of local, circumstellar dust absorption. A dozen of optically unidentified X-ray sources are here found among the high-extinction 2MASS sources, free from IR excesses: these are probably background, X-ray bright objects unrelated to the cluster.
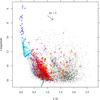 |
Fig. 16 2MASS (J,J−H) color−magnitude diagram for all IR sources in the ACIS FOV. The blue (green) line is a Siess (BHAC) isochrone at 5 Myr. A representative reddening vector is also shown. Symbols as in Fig. 11. Green crosses are optically unidentified X-ray sources. |
When considering the (J−H,H−K) color−color diagram (Fig. 17), the X-ray detected and Hα-excess stars are both found at a place consistent with low and uniform extinction. Most of the high-extinction objects just discussed fall on a reddened-MS path. In this diagram, less than a dozen stars exhibit significant K-band excesses with respect to reddened MS colors, among which only three detected in X-rays. A few tens additional stars have possible excesses as well, but at a low significance level, and are not considered. In any case the population of X-ray sources in the “T Tauri star locus” (Meyer et al. 1997) is considerably less numerous than in the IR color−color diagram of other massive clusters like NGC 6530 (Damiani et al. 2006b) or the (less massive) ONC, suggesting that stars in NGC 6231 are found in a different (later) stage of disk-clearing with respect to those younger clusters. Also in the Cyg OB2 association, more massive than NGC 6231, the 2MASS color-color diagram yielded only a low number of IR-excess PMS stars (Albacete-Colombo et al. 2007).
Figure 17 does not show an extremely red object (2MASS J16532258-4148294: J−H = 4.59, H−K = 3.34) falling off to the right, which at first seemed an embedded protostar (with a K band excess), none of which are known in NGC 6231 (we noted above that no stars younger than about 2 Myr are found in the cluster). This object falls in the North-Western outer part of the ACIS FOV. From its J−H and H−K colors, an optical extinction of AV ~ 25 mag is estimated; it has no optical nor X-ray counterpart in our data. Rather than with a protostar, it is probably better identified with the strong IR source IRAS 16498-4143 (within 4.6′′) and with the maser source OH 343.4+1.3 (at 0.68′′), which is a candidate OH/IR giant (Sevenster et al. 1997).
6. Spatial distributions of stellar groups
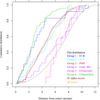 |
Fig. 18 Cumulative distributions of distances from cluster center for X-ray detected sources in different groups. Only sources with more than 20 counts are included. We also show a spatially uniform, flat distribution as a reference. |
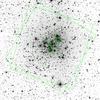 |
Fig. 19 DSS2-red image of NGC 6231, with superimposed positions of optically-unidentified X-ray sources (green crosses). The boundaries of the two ACIS FOVs are also indicated. |
Each of the groups defined above contains a large enough number of stars that their spatial distributions carry significant information on the group content. We have computed the cumulative distributions of distances from cluster center (defined in Sect. 3) for X-ray detected sources in all groups, as shown in Fig. 18. Since the X-ray detection threshold is not uniform across the FOV but rises from 4−5 X-ray counts near field center to ~20 counts at the outer border, spatially-unbiased distributions require consideration of detections with more than 20 counts only. The expected distribution of objects falling uniformly across the combined ACIS FOV (“flat distribution”) is also shown for comparison. Groups 1−6 are disjoint samples (no common stars), while Hα-excess and IR-excess samples are actually subsets of the other groups (uncategorized by group). Stars in groups 1−3 (OB, A−F, and PMS stars) are obviously more strongly concentrated than the uniform distribution. OB stars are much more concentrated than the A−F stars, which we take as evidence of mass segregation, as already claimed for NGC 6231 massive stars by Raboud & Mermilliod (1998), Raboud (1999), and SSB. The same phenomenon was found in other massive clusters (e.g. λ Ori, Dolan & Mathieu 2001, 2002; NGC 2362, Damiani et al. 2006a). Segregation seems instead not present among the X-ray detected A−F stars, whose spatial distribution is nearly identical to that of PMS stars.
The very centrally concentrated distribution of the optically unidentified X-ray sources in group 6, very similar to that of the OB stars, is very interesting. We rule out that these are OB stars, since the SSB catalog is complete at bright magnitudes; they cannot even be dominated by highly-reddened OB stars, since only few of them appear as reddened objects in the IR diagrams discussed above, and the X-ray spectral data (to be discussed below) indicate no particularly large extinction for the bulk of them. Therefore, the best explanation for their strong central clustering is that their missed optical counterparts are faint cluster stars hidden in the glare of the brightest cluster stars (10−15 mag brighter). This is supported by the DSS image in Fig. 19, where we show the positions of the unidentified X-ray sources, nearly coincident with the brightest stars. The Chandra X-ray image of NGC 6231 does not suffer from glare, because the luminosity contrast between the high-mass stars and the lowest-mass ones is attenuated by a factor of ~104 with respect to the optical (X-ray to bolometric luminosity ratios will be discussed below). Therefore, a large fraction of the optically unidentified X-ray sources should be considered as cluster members. We discuss these stars in greater detail on the basis of the X-ray data below.
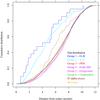 |
Fig. 20 Cumulative distributions of distances from cluster center for X-ray undetected sources in different groups. |
The X-ray detected Hα-emission stars have a spatial distribution extremely similar to that of cluster PMS stars (Fig. 18), and are indeed strongly dominated by CTTS members of the cluster. The distribution of IR-excess stars is markedly wider, instead, and more similar to a flat distribution. This may be attributed to (at least) three causes: (1) the IR-excess stars are generally not cluster members; (2) 2MASS data near the cluster center are biased; (3) genuine cluster members with disk avoid the central cluster region and the OB stars concentrated there. Of these hypotheses, the first seems unlikely, since the IR-excess stars found here are too many for a field population, at a distance no greater than the cluster. The second hypothesis is partially true, since the spatial density of 2MASS sources fainter than J ~ 15 is found to be lower near cluster center than in the outer parts, which is again explained by the glare of massive stars preventing detection of the faintest stars nearby; we checked, however, that the difference between the spatial distributions of PMS stars in group 3 and IR-excess stars still remains for brighter 2MASS sources (J< 15), at a significance level of 99.67%: therefore, this favors our third hypothesis, that indeed circumstellar disks tend to avoid the vicinity of OB stars, where they are disrupted on shorter timescales. A similar result was obtained by Guarcello et al. (2007, 2010b) in the case of the massive cluster NGC 6611, and very recently by Zeidler et al. (2016) for Westerlund 2. X-ray detected stars in the Field-MS and Foreground groups have spatial distributions similar to a flat distribution, consistently with these groups being composed of field stars. The statistical significance of the pairwise differences between these distributions was tested by means of Kolmogorov-Smirnov tests, whose results are reported in Table 1.
K-S test probabilities (%) of no difference between subgroups.
Figure 20 shows instead the spatial distributions of stars undetected in X-rays (or detected with less than 20 counts) in the various groups, in the ACIS FOV. Here stars in groups 3−6 have distributions nearly identical to a flat distribution. The X-ray undetected OB stars have instead a centrally-clustered distribution, but less so than the X-ray detected OB stars of Fig. 18. This intermediate degree of central clustering may be explained by noting that the X-ray undetected massive stars are in fact all of B type (Fig. 5), and these may be less centrally segregated than the more massive stars. Because of their rarity, both X-ray detected and undetected OB stars must be cluster members. The X-ray undetected A−F stars also have a spatial distribution similar to the undetected B stars, and nearly identical to that of the X-ray detected A−F stars of Fig. 18. Therefore, the fraction of field stars in both the X-ray detected and undetected A−F groups must be very nearly the same. The X-ray detected A−F stars have in turn a distribution almost coincident with the cluster PMS stars, as mentioned above, which suggests that (nearly) all A−F stars, either X-ray detected or not, are cluster members. To avoid this conclusion, one should hypothesize a rather ad-hoc combination of mildly-segregated A- or B-type stars plus some number of uniformly-distributed A−F field stars, whose combined spatial distribution would mimic that of cluster PMS stars: this seems rather unlikely.
The distribution of Hα-emitting stars not detected in X-rays is intermediate between a flat one and the distribution of cluster PMS stars. The Hα thresholds used to define the Hα-emitting sample are appropriate to CTTS stars (above the chromospheric Hα level), which are not expected to be found among field stars. If all Hα-emitting stars are indeed members, such broader distribution with respect to all cluster PMS stars might again be a clue that accretion from circumstellar disks terminates earlier in the innermost cluster regions where OB stars are found. The distribution of X-ray undetected IR-excess stars is very similar to that of X-ray detected ones, so again the same considerations apply.
7. X-ray spectra
The low-resolution X-ray spectra provided by ACIS are useful both to help classifying the detected sources, and to obtain information on the nature of their X-ray emission. Most of the X-ray sources are relatively faint: only 16 have more than 500 X-ray counts (all massive stars or flaring Group 3 stars), and 176 have more than 100 counts. Therefore, only for a very small fraction of sources we can attemp to fit their individual spectra to obtain meaningful spectral parameters. However, some spectral information can also be obtained by considering X-ray hardness ratios, even for sources with few counts.
7.1. X-ray hardness ratios
We define here two hardness ratios as HR1 = (M−S) / (M + S), and HR2 = (H−M) / (H + M), where S, M, and H are the source X-ray counts in the soft (0.3−1.2 keV), medium (1.2−2.2 keV), and hard (2.2−8.0 keV) bands, respectively. Relatively high values of HR1 and HR2 are indicative of harder (hotter) X-ray emission, while a high HR1 is also indicative of high absorption, the latter hiding selectively the softer emission. The hardness ratios of our detections are reported in Table B.1. We show the cumulative distributions of HR1 and HR2 for the different groups of sources in NGC 6231 in Figs. 21 and 22, respectively. Only non-flaring sources with more than 20 X-ray counts are included in these distributions, since flaring spectra may be much harder than quiescent ones, and introduce a bias. Flaring sources are here selected as having lightcurves statistically incompatible with both a uniform level, and a constant slope. Figure 21 shows that the median HR1 is very nearly the same for all groups, except for the OB stars, which have a lower median HR1. We have discussed in Sect. 5 that OB and low-mass PMS stars share a common average extinction value, and therefore the low median HR1 for OB stars is unlikely to be related to a lower absorption. Since massive stars are typically softer X-ray sources than lower-mass stars, the lower HR1 is more probably related to a predominantly softer emission rather than to an increased absorption with respect to lower-mass X-ray sources. Figure 21 shows also some difference among the different groups in the upper tail of the HR1 distribution, with an extended tail more prominent among Field-MS and unidentified X-ray sources. This is still more obvious from the HR2 distribution of Fig. 22 (where we find again a lower median for OB stars, related to their soft emission spectrum): here sources in the Field-MS and unidentified groups are distributed in a distinctly different way than other sources, showing enough X-ray emission above 2.2 keV to raise the HR2 value above zero in ~35% of cases.
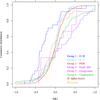 |
Fig. 21 Cumulative distributions of hardness ratio HR1 for non-flaring stars in different groups. |
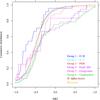 |
Fig. 22 Cumulative distributions of hardness ratio HR2 for non-flaring stars in different groups. |
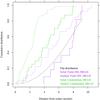 |
Fig. 23 Cumulative distributions of distances from cluster center for X-ray detected sources in groups 4 (Field-MS) and 6 (unidentified). We show separately hard (HR2 > 0) and soft (HR2 ≤ 0) sources, respectively. The dotted line is a spatially uniform distribution. |
The discussion above suggests that the majority of the Field-MS sources are not cluster members, and we will not discuss them further; on the other hand, we argued that most of the unidentified X-ray sources are good candidate members, so that their HR2 distribution being so different from that of the cluster stars is puzzling. Figure 22 suggests that a threshold near HR2 = 0 may be an effective means of separating X-ray sources of different nature inside these two groups. Accordingly, the spatial distributions of sources in these two groups are shown again in Fig. 23, but separately for sources having HR2 less and greater than zero, respectively. The figure shows that the softer sources in each group have a more centrally concentrated distribution than the hard sources. In particular, this reinforces our earlier suggestion that the unidentified sources with HR2 < 0 are all cluster members. The limited statistics of the two Field-MS subsamples is such as the distributions of both the harder and softer sources are compatible with a flat distribution (non-members). A bit puzzling is the distribution of unidentified sources with HR2 > 0, found significantly different than a flat distribution (99.98% level), which would suggest that these unusually hard (but non-flaring), weak X-ray sources are clustered towards the center of NGC 6231. A caveat against this conclusion might be that unidentified X-ray sources are rarer in the outer part of the FOV (regardless of their spectrum) simply because the wider ACIS PSF there ensures more counterparts to be found (including spurious ones). Therefore, we conclude that only the unidentified X-ray sources with HR2 < 0 should be reliably included among cluster candidate members.
7.2. X-ray spectral fits
As said above, only very few X-ray sources in NGC 6231 are detected with more than 500 counts, and therefore X-ray spectral parameters cannot be reliably determined for the great majority of sources. However, the cumulative number of X-ray counts for all sources in a given group is generally high enough for a meaningful spectral fit, assuming that their intrinsic spectra are homogeneous enough for this treatment to make sense. The above distributions of hardness ratios HR1, HR2 are narrow enough to support this assumption, except for the hard-soft dichotomy among the unidentified sources, which were therefore treated separately. While in principle also the Field-MS sources would need to be similarly splitted into a soft and hard group, in practice their total X-ray counts are too few to permit this. Moreover, the richest group of PMS stars was split in two subgroups, respectively bluer and redder than V−I = 2.2. This was motivated by the apparent trend of increasing HR2 towards fainter PMS members, as shown in Fig. 24. Therefore, we proceeded by computing summed spectra of all sources in a group and fitting the average spectra thus obtained, using Xspec v12. We excluded from this procedure sources showing flares, and also the 9 non-flaring, massive sources with more than 500 counts2, which are exceedingly stronger than the rest of stacked spectra, and whose inclusion would make the group too inhomogeneous. We jointly fit X-ray spectra from both ObsId 5372 and 6291; however, the cumulative group spectrum from each ObsId has its own instrument response function, and their combination is done only at the fitting stage by Xspec. We have attempted to fit these combined spectra using six different models, choosing afterwards the one giving the most successful fits. All six models are three-temperature (3T) APEC models. In models 1−5, the three temperatures are fixed at the values of 0.5, 1.0 and 2.0 keV, respectively, while in model 6 they are allowed to vary. The metal abundance is held fixed at 0.1 times solar in models 1−3, and at 0.3 solar in models 4−6. Absorption NH is held fixed at 3.22 × 1021 cm-2 (as derived from the optical extinction) in models 2, 3 and 5, and left free in the other cases. The emission-measure ratios between the three thermal components are held fixed in models 1−2, at values EMmiddle/EMcool = 0.85 and EMhot/EMcool = 0.7, which gave good results in the case of NGC 2362 (Damiani et al. 2006a). The first two models gave generally poorer fits than models 3−6. The latter four models gave similar acceptance probabilities for each spectrum; however, visual inspection of observed spectra and model fits showed that some features were consistently better reproduced by the last model, which has the largest number of free parameters. We therefore adopt this latter spectral model, for all groups except for Field-MS and Foreground, which because of the small number of total X-ray counts were fitted using a 2T model (with fixed absorption NH in the case of Foreground sources). Observed (cumulative) spectra and model fits are shown in Figs. 25 and 26.
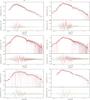 |
Fig. 25 Summed X-ray spectra (crosses) of sources in groups 1−5, with model fits. The black and red observed spectra correspond to ObsIds 5372 and 6291, respectively. |
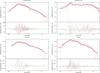 |
Fig. 26 Summed X-ray spectra of optically unidentified sources with HR2 < 0 (top left) and HR2 > 0 (top right), and of Hα-excess and IR-excess stars (as labeled), with model fits. |
X-ray fitting results for combined spectra. Emission-measure units are only relative.
For unidentified hard sources the 3T model with a single absorption value yielded always unsatisfactory fits. A much better model had two free temperatures, each component with a different absorption NH, left free to vary (metal abundance were instead set to 0.3 times the solar value). The fit yielded a χ2/ d.o.f. = 173.9 / 144 (probability P = 0.045), and best-fit parameters kT1 = 1.35 keV, NH1 = 4.76 × 1020 cm-2 for the soft component, and kT2 = 6.34 keV, NH2 = 3.93 × 1022 cm-2 for the hard component. Table 2 reports the best-fit parameters for each group. Also listed is the count-rate to flux conversion factor, corrected for absorption, which is used to compute source X-ray luminosities (in the 0.4−8.0 keV band), listed in Table B.1. In particular, the conversion factor for Group 3 sources, assuming a minimum number of 20 X-ray counts for a detection anywhere in the FOV, implies for the PMS members completeness down to LX ~ 8.4 × 1029 erg/s. The minimum detected X-ray luminosity for optically unidentified soft sources (and likely members as well) is LX ~ 2.0−2.4 × 1029 erg/s, attained only in the FOV center.
The best-fit absorption NH from Table 2 for OB, A−F, and PMS stars is consistent with the value inferred from optical extinction. IR- and Hα-excess stars have best-fit NH twice as large, which might indicate higher gas and dust column densities towards these stars; however, the number of X-ray counts used in the fits are smaller than for the other member groups, so the actual significance of the increased best-fit absorption is unclear. The A−F stars have X-ray temperatures very close to the PMS-bright stars, in agreement with the hypothesis that their emission originates from coronae of colder binary companions (which we discuss in detail below). The comparison between best-fit temperatures of bright and faint PMS members confirms that the average X-ray emission hardens towards the lower-mass stars, even disregarding flaring stars. The best-fit temperatures of soft unidentified sources (also to be discussed below) are approximately consistent with those of the fainter PMS stars.
8. X-rays from massive stars
Upper limits to X-ray luminosities of undetected massive stars.
We have studied the X-ray emission of massive O and B stars in the cluster. While they has been studied using XMM-Newton data by Sana et al. (2006b), our higher-resolution Chandra image enables us to test if their results are affected by source confusion, which may easily happen in such a dense cluster. This may be especially true for the B stars, which generally have X-ray luminosities comparable to lower-mass stars, and are outnumbered by these latter stars by a large factor. We have therefore computed LX upper limits for all massive stars listed by Sana et al. (2006b) which remained undetected in our observation, as reported in Table 3. However, it turns out that all massive stars positively detected in X-rays by Sana et al. (2006b, their Table 2) are also detected in our data (if falling within the ACIS FOV). Their conclusions on X-ray emission from massive stars are therefore not affected by source misidentification. Since the XMM-Newton X-ray spectra of these stars presented by Sana et al. (2006b) have a considerably larger number of photons than the ACIS spectra in our datasets, we do not consider them further here.
We have studied source #1008 (the Wolf-Rayet star HD 152270 = WR 793), which was not studied by Sana et al. (2006b), and has a peculiar, hard spectrum (Fig. 27). Despite being clearly identified with a massive star, this spectrum shares some similarities with that of the fainter unidentified hard sources fitted above (hard and soft components with differing absorption), and is accordingly well fitted (χ2/d.o.f. = 31.2/31) by a two-temperature model (kT = 1.1 and 1.9 keV) with very different absorption (NH = 2.18 × 10²² and 49.4 × 1022 cm-2, respectively, the latter being poorly constrained). Compared to the above fits of unidentified hard sources, the absorption of both components in WR 79 is much larger. It would correspond (using an interstellar gas-to-dust ratio) to optical extinctions towards the two components of 10 and >200 mag, respectively, far higher than the star optical extinction (no different from the rest of the cluster, judging from the optical two-color diagram). Examining the X-ray image, the hard and soft components do not appear to be spatially distinct, making unlikely a chance superposition with a heavily obscured background source. Also the agreement between X-ray and optical or IR positions is very good (0.17′′ using the 2MASS position), and the intensity (count rate) of the source is much larger than all hard unidentified sources (where most background objects are expected to fall). Therefore the observed spectrum is most likely intrinsic to WR 79. The hard, strongly absorbed spectrum of WR 79 is reminiscent of that of WR 20a in Westerlund 2 (Nazé et al. 2008), but is still hotter and more absorbed than it; if interpreted in the same framework, it suggests production of hard X-rays in stronger shocks within a denser wind-wind collision zone, compared to WR 20a. In the same way, the hard-component absorption is significantly higher in WR 79 than in the WR stars in Westerlund 1 (Skinner et al. 2006a), and in the colliding-wind binary WR 147 (Skinner et al. 2007; Zhekov 2007). WR 79 is actually one of the few WR stars of type WC to be detected in X-rays (Oskinova et al. 2003; Skinner et al. 2006b) probably because of its binary nature.
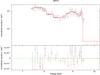 |
Fig. 27 X-ray spectrum of source #1008 (HD 152270, WR 79), with best-fit 2T model. |
9. X-rays and stellar properties
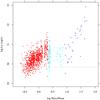 |
Fig. 28 Plot of X-ray luminosity LX vs. stellar mass. Symbols as in Fig. 4. The dotted horizontal line is our completeness limit. The narrow gap at ~1.4 M⊙ is an artifact corresponding to the transition between the BHAC and Siess et al. (2000) isochrone sets used. |
We study here how X-ray emission is related to stellar properties in NGC 6231. Apart from massive stars, very little detail is known for other cluster members. For these latter we use the available optical photometry to estimate stellar masses and bolometric luminosities Lbol, assuming for all stars the same average cluster reddening and distance. In particular, masses and Lbol were computed for PMS stars using the BHAC or Siess et al. (2000) 5-Myr isochrone in the (V,V−I)) CMD (as discussed in Sect. 5), and masses of higher-mass MS stars (above ~7 M⊙) using the 3-Myr non-rotating solar-metallicity isochrone from Ekström et al. (2012). The B0.7Ia supergiant HD 152235 was assigned a mass of 30 M⊙ according to Fraser et al. (2010). Bolometric luminosities for OB stars were taken from Sana et al. (2006b). For X-ray sources showing flares in their lightcurve, we have interpolated or extrapolated the lightcurve outside the flare to compute “quiescent” X-ray luminosities, which are used here (both quiescent and average LX values are reported in Table B.1, as well as the Kolmogorov-Smirnov test probability PK−S that the source emission is not compatible with being constant).
Figure 28 shows the X-ray luminosity LX vs. the stellar mass for cluster member stars. At low masses, LX increases rapidly with mass until M ~ 2 M⊙, shows a large spread between 2 M⊙<M< 10 M⊙, and increases again for higher masses. We have seen in Sect. 5 that the 2−3 M⊙ range is the one comprising stars either just arrived on the ZAMS, or still crossing the radiative track during their PMS evolution. This relatively small mass range therefore comprises a wide range of stellar spectral types (from type A to G-early K), because of the cluster age spread, and a corresponding range of stellar structures (from absence to preponderance of convective envelopes). The large LX spread we find for the 2−3 M⊙ range agrees with a different origin between X-rays from early and late-type stars in this mass range, with late-type stars being more X-ray luminous, up to LX ~ 1031 erg/s. The mass range in which the PMS-ZAMS transition occurs depends on the cluster age (and age spread): for a younger cluster such as the ONC this transition occurs at higher masses, so that the X-ray luminosity keeps increasing with mass up to higher masses (~3 M⊙) while still in the PMS stage, and reaches up to LX ~ 1031.5 erg/s or more (Flaccomio et al. 2003), before it declines in higher-mass ZAMS stars. As already noted when discussing the Hα-index diagram of Fig. 13, the pattern of LX vs. stellar mass of Fig. 28 agrees therefore with the estimated age of NGC 6231.
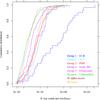 |
Fig. 29 Cumulative distributions of time-averaged X-ray count rates for the various groups. The PMS group is shown in its entirety (solid red line), and split between stars respectively brighter (dotted red line) and fainter (dashed red line) than V = 20.5. |
Figure 29 shows cumulative distributions of X-ray count rates for the various groups. In order to test if, as suggested above, the (soft) optically unidentified X-ray sources are consistent with being low-mass cluster members we have shown the cumulative count-rate distribution for PMS stars both in its entirety, and separately for stars brighter and fainter than V = 20.5, respectively: the latter count-rate distribution is nearly identical to that of unidentified sources, strengthening even more our previous arguments in favor of their membership.
X-ray emission from A-type stars, which we detect in a large number, is a puzzle because these stars, most of which already on the ZAMS or in their late PMS stages (Fig. 4), do not possess deep convection zones. When detected, X-ray emission from A stars is often attributed to lower-mass binary companions, an hypothesis which we can readily test. In Fig. 18 we have seen that detected A−F stars have a similar spatial distribution to detected PMS stars; moreover, their distributions of HR1 and HR2 were also similar to those of the PMS stars (Figs. 21 and 22), consistently with the binary hypothesis. Here, Fig. 29 shows that their count-rate distribution is almost identical to that of the (brighter) PMS stars, again consistent with the binary hypothesis. Finally, the number ratio between the X-ray detected A−F stars and the undetected A−F stars (which were argued above to be members because of their spatial distribution) is 95/189 = 0.5, which corresponds to a binary fraction of 0.33 if binarity accounts for all X-ray detections in the A−F group. This number is not unreasonable, especially in NGC 6231 which was found to contain a large percentage of massive binaries; it is also consistent with our (lower limit to the) binary fraction for PMS stars found above. Sana et al. (2006b) also conclude that the binary picture is the best explanation for their X-ray detection of late-B and A stars in NGC 6231.
We also show in Fig. 30 the dependence of the ratio LX/Lbol vs. stellar mass, already studied for the ONC (Flaccomio et al. 2003, their Fig. 6) and NGC 2362 (Damiani et al. 2006a, their Fig. 13), among other young clusters. The bulk of NGC 6231 PMS stars fall in the range − 3.5 < log LX/Lbol< −2.5. This is a higher average LX/Lbol ratio than PMS stars in the ONC in the same mass range (Flaccomio et al. 2003). Since it has been shown that ONC PMS stars with strong accretion from a circumstellar disk have on average a reduced X-ray emission with respect to non-accreting stars of the same mass, the observed behaviour in NGC 6231 is consistent with the low fraction of cluster stars having accretion disks (~5%, see Sect. 5.4), and stars with strong Hα-emission (~9%, see Sect. 5.3). For more massive stars (2 < log Lbol/Lbol, ⊙< 6) our result agrees qualitatively with that of Sana et al. (2006b). In both the ONC and NGC 2362 a nearly constant LX/Lbol ratio is found for low masses up to a cutoff mass, beyond which the ratio decreases rather abruptly by several orders of magnitude, down to the canonical ratio ~10-7 for the OB stars. Figure 30 shows that this age-dependent discontinuity occurs at a mass ~2 M⊙ in NGC 6231, while the corresponding figure for the ONC (1−2 Myr old) shows a cutoff mass of 3 M⊙. In NGC 2362 (5 Myr) the cutoff mass is similar to that of NGC 6231, but is less well defined since it is a less populated cluster.
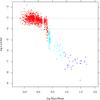 |
Fig. 30 Ratio LX/Lbol vs. stellar mass. The two dotted lines indicate log LX/Lbol = −3 and − 4, respectively. |
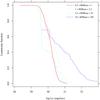 |
Fig. 31 Kaplan-Meier maximum-likelihood X-ray luminosity functions for members stars in different mass ranges, as indicated. |
Figures 28−30 are based on X-ray selected stellar samples, and thus do not account for X-ray undetected member stars. We have therefore computed X-ray luminosity upper limits for the undetected cluster members in groups OB and A−F, to build maximum-likelihood LX distributions, separately for different mass ranges, as shown in Fig. 31. We have included among members the optically unidentified soft X-ray sources, which according to the discussion above are members near the low mass end of the X-ray detected PMS members. Since our X-ray selected sample of PMS members is complete down to a limiting flux LX ~ 8 × 1029 erg/s, we infer from Fig. 28 that this corresponds to almost 100% completeness in mass down to ~1 M⊙. We expect a number of X-ray non-detections in the lowest mass range shown in Fig. 31; however we did not include LX upper limits in that range, because we do not have an unbiased member list there. The red distribution in Fig. 31 is therefore an overestimate of the true distribution in the corresponding mass range. From Fig. 31 we see that in the 3−10 M⊙ mass range we do not sample the median X-ray luminosity, by a small margin, because of the large fraction of non-detections.
10. The cluster initial mass function
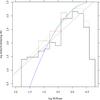 |
Fig. 32 Initial mass function (IMF) of NGC 6231 stars, computed under different assumptions on star membership, as explained in the text. Dotted lines are linear best fits to the black IMF (black dotted line) and to the green one (green dotted line). The blue dashed line is the Chabrier (2003) model IMF, with arbitrary normalization. |
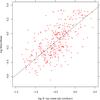 |
Fig. 33 Mass vs. X-ray count rate for PMS members. The dashed line is obtained from a principal-component analysis. Only non-flaring X-ray sources are shown, within 4 arcmin from cluster center. |
On the basis of the NGC 6231 membership determined above, we have also computed the cluster initial mass function (IMF). In order to have a better understanding of the uncertainties involved in the IMF determination, we have done it under several different assumptions. The first, and most conservative, approach is to consider only X-ray detected stars in groups OB, A−F, and PMS to be reliable members; as we have argued above, this is expected to yield very incomplete members samples among the B- and A-type stars, so the resulting IMF is a sort of “lower limit” to the true IMF. The IMF obtained in this way is shown in Fig. 32, as the black solid line. A linear fit in the plotted quantities (also shown in the figure) gives log [ΔN/ Δlog M] ~ 2.81−0.95log M (with star mass M in solar-mass units), including only mass bins above log M = 0, which is our estimated completeness limit as derived above.
A better assumption is to include among members also X-ray undetected stars in groups OB and A−F, at the risk of including a (minor) fraction of field stars as contaminants. It might be argued that the exact fraction of field stars in these color ranges can be estimated from consideration of nearby control fields; this approach is not assumption-free, however, since we argued above of the existence of strongly-rising extinction just behind the cluster, which might not be present in a “clean” reference field, that is sufficiently far from NGC 6231 center not to contain cluster members. We choose therefore not to rely on a reference field, and accept all OB and A−F candidate members in building an “upper limit” IMF: this is shown by the red dashed line in Fig. 32, sensibly different from the first IMF for masses between 3−10 M⊙.
Finally, we presented above strong evidence that the soft, optically unidentified X-ray sources must be low-mass members as well; lacking optical data their mass must be estimated differently. Here we take advantage of the LX-mass empirical relation found for example in Fig. 28 (as in many other young clusters). Expressed in terms of the X-ray count rate (which makes the derivation independent of the adopted conversion factor between count rate and flux), we replot it in Fig. 33, for PMS stars only. A principal-component analysis yields the relation log M/M⊙ ~ 0.1084 + 0.46log rX, where rX is the ACIS X-ray count rate in counts/ks. Adding these mass estimates for unidentified soft X-ray sources, as well as the few Hα-emission X-ray undetected members, to the previous IMF yields the one shown in Fig. 32 with a green dashed line: the increment is modest, and almost limited to the lowest five mass bins, most of which are anyway affected by incompleteness, as discussed above. A linear fit gives log [ΔN/ Δlog M] ~ 3.19( ± 0.12)−1.14( ± 0.12)log M (shown in the figure). Also shown is the Chabrier (2003) model, with arbitrary normalization, which is not a good approximation of our data.
We therefore adopt Γ = −1.14 as the “best” value for the IMF slope, as this is based on the most complete NGC 6231 member list. SSB obtain from their analysis of NGC 6231 photometry a value of Γ = −1.1, slightly less steep than ours but consistent within the error, for log M/M⊙ ≥ 0. We suspect that this is affected, at the low-mass end, by an excessive statistical subtraction of putative field stars, based on a control field. Supporting this suggestion is the different sensitivity to faint stars near the cluster core and in any neighboring field free of bright stars, as already discussed in previous sections. Our X-ray based membership is very robust for the PMS members, down to our completeness limit which is nearly coincident with the lower-mass limit of the SSB IMF. Comparison between the CMD source density in the PMS band and that in the adjacent Field-MS and Foreground zones suggests that only very few (perhaps 1%) of the X-ray PMS members may be contaminants.
The total mass in our complete IMF is 2.81 × 10³M⊙ (of which 2.28 × 10³M⊙ above 1 M⊙), slightly larger than the SSB estimate (2.6( ± 0.6) × 103M⊙), but consistent with it within the uncertainties. Since the true IMF is unlikely to drop abruptly below our detection threshold, the true total mass must be larger than the above value. The Weidner et al. (2010) analytical IMF formulation predicts that the total mass is 1.92 times larger than the mass above 1 M⊙. Assuming this ratio holds here as well, and on the basis of our measured mass above 1 M⊙, we may infer a total NGC 6231 stellar mass of 4.38 × 10³M⊙. This is very close to the total NGC 6231 mass reported in Weidner et al. (2010) ( ), on the basis of earlier observations.
10.1. Completeness and contamination
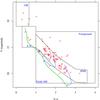 |
Fig. 34 Optical CMD of XMM-Newton X-ray sources falling outside our Chandra FOV (red crosses). The same loci as in Fig. 4 are indicated in black. The green line is the ZAMS at the cluster distance, while in blue are BHAC evolutionary tracks for stars of masses M = 0.5,1,1.4 M⊙. |
We mention here two competing effects which may have biased our above determinations of the IMF shape and total cluster mass: the number of cluster members falling outside the studied field (incompleteness), and the number of unrelated young stars mistakenly included in our sample (contamination). This latter might be important because NGC 6231 belongs to the Sco OB1 association (see the review by Reipurth 2008). The space density of stars in NGC 6231 is clearly much higher than the diffuse population of Sco OB1, and we argued above that most of the cluster is comprised in our Chandra ACIS FOV, so these effects are small corrections to our determinations. We may nevertheless obtain an estimate of the number of stars involved from the existing XMM-Newton observations of Sana et al. (2006a, 2007). There are 132 of their X-ray sources falling outside our combined ACIS FOV, over a spatial region ~1.4 times wider than our surveyed area. Their placement in the optical CMD is shown in Fig. 34. Two ot the most massive stars there are included by Sana et al. (2008) among NGC 6231 members. Most of the lower-mass additional X-ray sources in the figure fall in the same PMS band as our studied members, and are therefore good candidates as additional NGC 6231 members (110 stars), distributed in a low-density halo around the cluster core. This is consistent with the spatial density at the outer border of our FOV (≤1 source/square arcmin, Fig. 2). The total combined mass of all presumably missed members is of order of ~150 M⊙, or an additional 7% to our above estimates. A fraction of them might however belong to the diffuse Sco OB1 population, which is little studied and therefore difficult to quantify, especially with respect to the low-mass populations. If we for example assume that the low-mass stars detected with XMM-Newton are genuine NGC 6231 halo members, but the few OB stars are from the diffuse population (and the same number of extraneous OB stars must be subtracted from our sample), we would add ~100 M⊙ of low-mass stars and subtract ~50 M⊙ of OB stars, with a net increase of only ~50 M⊙ in our total-mass estimate (~2%). Therefore, those estimates are not severely affected by incompleteness and contamination. It may be interesting to remark that if the last scenario is true (a few contaminating OB stars and many missed halo low-mass members in our sample), this might at least partially account for the low IMF slope found above.
11. Conclusions
We have observed with Chandra ACIS-I the young cluster NGC 6231 in Sco OB1, detecting 1613 point X-ray sources down to log LX ~ 29.3 (a complete sample down to log LX ~ 29.8). Most of the detected sources are without doubt low-mass cluster members, and permit an unprecedented study of the late-type population of this very rich cluster. The cluster morphology is found to be nearly spherical, with a small elongation orthogonal to the galactic plane. Comparison of the X-ray source list with existing optical and 2MASS catalogues has allowed identification of 85% of the X-ray sources. The optical color−magnitude diagram of X-ray detected sources shows, in addition to many tens massive stars, a richly populated PMS cluster band with a definite spread in ages (between ~1−8 Myr). The PMS stars appear slightly older than the massive (main-sequence or evolved) OB stars. Upon comparison with existing model isochrones, we find the Baraffe et al. (2015) models in better agreement with our data than the older Siess et al. (2000) models. The shape of the V-magnitude spread across the PMS band is suggestive of a (equal-mass) binary fraction of ~20%. The IR color distribution suggests a rapid increase in extinction, by several magnitudes in V, at some distance behind the cluster.
The likelihood of membership for different star groups, defined from their position on the optical CMD, was studied by means of their spatial distribution, X-ray hardness and luminosity. We argue that the vast majority of OB and A−F stars are cluster members, regardless of their X-ray detection. The X-ray detection fraction of late-B and A stars is consistent with the hypothesis that the actual X-ray emitter is a later-type companion, while the more massive star is X-ray dark. We confirm the spatial segregation of the most massive stars, as suggested by previous studies.
We find 203 Hα-excess stars in the X-ray FOV, with Hα intensities typical of CTTS. About one-half of them lie in the cluster PMS band, and are added to our member list; of the latter, ~40% were not detected in X-rays. The derived fraction of Hα-excess PMS stars is ~9%, in good agreement with the trend shown by other clusters at the same age. The Hα-excess stars have no significantly different X-ray properties than the rest of PMS stars. We also find 48 bona-fide IR-excess sources, probably related to circumstellar disks, whose frequency is therefore ~5% for NGC 6231 PMS stars. The spatial distribution of the IR-excess stars, both X-ray detected and undetected, is significantly wider than that of PMS stars: we argue that this is evidence of increased photoevaporation of disks in the vicinity of the cluster OB stars. A similar trend is also shown by X-ray undetected CTTS, strengthening this conclusion.
Approximately 70% of the optically unidentified X-ray sources show (spatial and X-ray) properties well consistent with those of the cluster PMS stars at their low-mass end, and we suggest that they are low-mass members as well. The remaining 30% of unidentified sources show instead much harder, multi-component X-ray spectra very unlike cluster stars, and do not appear otherwise connected with the cluster. With more than 1300 stars with individually-determined membership, this dataset enables us to study NGC 6231 with an unprecedented detail, across a wide range of masses, down to ~0.3 M⊙ (complete to ~1 M⊙).
The X-ray properties of NGC 6231 stars are in agreement with those of coeval clusters. The mass above which LX/Lbol drops is an age indicator, which agrees with the isochronal age, and is also consistent with the age-dependent discontinuity in the (Hα,V) diagram.
We find a complex, doubly-peaked X-ray spectrum for the Wolf-Rayet star WR 79, with more extreme characteristics than exhibited by stars of similar type; WR 79 is one of the few WC-type stars detected in X-rays.
Using all available membership information, we compute the cluster IMF under different hypotheses, and over nearly 2 orders of magnitude in mass. We find a best-fit slope Γ = −1.14, consistent with that found by SSB but slightly closer to the Salpeter value. The total mass of individually selected cluster members above 1 M⊙ is found to be 2.28 × 10³M⊙, while the total mass extrapolated to the bottom of the mass spectrum according to the Weidner et al. (2010) analytical IMF is 4.38 × 10³M⊙, in agreement with previous estimates. This confirms that NGC 6231 ranks among the most massive known young clusters in the Milky Way.
Available at http://www.astropa.unipa.it/progetti_ricerca/PWDetect/
This star must not be confused with WR 79a, lying more than half a degree away outside the ACIS FOV, and studied in X-rays by Skinner et al. (2010).
Acknowledgments
We thank the referee for his/her useful suggestions. We acknowledge support from the italian MIUR. The scientific results reported in this article are based on observations made by the Chandra X-ray Observatory (ObsIds: 5372, 6291). This research has made use of software provided by the Chandra X-ray Center (CXC) in the application package CIAO. This work was also using data products from observations made with ESO Telescopes at the La Silla Paranal Observatory under programme ID 177.D-3023, as part of the VST Photometric Hα Survey of the Southern Galactic Plane and Bulge (VPHAS+, www.vphas.eu). This study has made use of the 2MASS database. We also used data from the SIMBAD database, operated at CDS, Strasbourg.
References
- Albacete Colombo, J. F., Flaccomio, E., Micela, G., Sciortino, S., & Damiani, F. 2007, A&A, 464, 211 [NASA ADS] [CrossRef] [EDP Sciences] [Google Scholar]
- Baraffe, I., Homeier, D., Allard, F., & Chabrier, G. 2015, A&A, 577, A42 (BHAC) [NASA ADS] [CrossRef] [EDP Sciences] [Google Scholar]
- Baume, G., Vázquez, R. A., & Feinstein, A. 1999, A&AS, 137, 233 [NASA ADS] [CrossRef] [EDP Sciences] [Google Scholar]
- Bessell, M. S., & Brett, J. M. 1988, PASP, 100, 1134 [NASA ADS] [CrossRef] [Google Scholar]
- Chabrier, G. 2003, ApJ, 586, L133 [NASA ADS] [CrossRef] [Google Scholar]
- Cutri, R. M., Skrutskie, M. F., Van Dyk, S., et al. 2003, Explanatory Supplement to the 2MASS All Sky Data Release, http://www.ipac.caltech.edu/2mass/releases/allsky/doc/explsup.html [Google Scholar]
- Damiani, F., Maggio, A., Micela, G., & Sciortino, S. 1997a, ApJ, 483, 350 [NASA ADS] [CrossRef] [Google Scholar]
- Damiani, F., Maggio, A., Micela, G., & Sciortino, S. 1997b, ApJ, 483, 370 [NASA ADS] [CrossRef] [Google Scholar]
- Damiani, F., Flaccomio, E., Micela, G., et al. 2003, ApJ, 588, 1009 [NASA ADS] [CrossRef] [Google Scholar]
- Damiani, F., Flaccomio, E., Micela, G., et al. 2004, ApJ, 608, 781 [NASA ADS] [CrossRef] [Google Scholar]
- Damiani, F., Micela, G., Sciortino, S., et al. 2006a, A&A, 460, 133 [NASA ADS] [CrossRef] [EDP Sciences] [Google Scholar]
- Damiani, F., Prisinzano, L., Micela, G., & Sciortino, S. 2006b, A&A, 459, 477 [NASA ADS] [CrossRef] [EDP Sciences] [Google Scholar]
- Dolan, C. J., & Mathieu, R. D. 2001, AJ, 121, 2124 [NASA ADS] [CrossRef] [Google Scholar]
- Dolan, C. J., & Mathieu, R. D. 2002, AJ, 123, 387 [NASA ADS] [CrossRef] [Google Scholar]
- Drew, J. E., Gonzalez-Solares, E., Greimel, R., et al. 2014, MNRAS, 440, 2036 [NASA ADS] [CrossRef] [Google Scholar]
- Ekström, S., Georgy, C., Eggenberger, P., et al. 2012, A&A, 537, A146 [NASA ADS] [CrossRef] [EDP Sciences] [Google Scholar]
- Fitzgerald, M. P. 1970, A&A, 4, 234 [NASA ADS] [Google Scholar]
- Flaccomio, E., Damiani, F., Micela, G., et al. 2003, ApJ, 582, 398 [NASA ADS] [CrossRef] [Google Scholar]
- Fraser, M., Dufton, P. L., Hunter, I., & Ryans, R. S. I. 2010, MNRAS, 404, 1306 [NASA ADS] [Google Scholar]
- García, B., & Mermilliod, J. C. 2001, A&A, 368, 122 [NASA ADS] [CrossRef] [EDP Sciences] [Google Scholar]
- Getman, K. V., et al. 2005, ApJS, 160, 319 [NASA ADS] [CrossRef] [Google Scholar]
- Guarcello, M. G., Prisinzano, L., Micela, G., et al. 2007, A&A, 462, 245 [NASA ADS] [CrossRef] [EDP Sciences] [Google Scholar]
- Guarcello, M. G., Damiani, F., Micela, G., et al. 2010a, A&A, 521, A18 [NASA ADS] [CrossRef] [EDP Sciences] [Google Scholar]
- Guarcello, M. G., Micela, G., Peres, G., Prisinzano, L., & Sciortino, S. 2010b, A&A, 521, A61 [NASA ADS] [CrossRef] [EDP Sciences] [Google Scholar]
- Haisch, K. E., Lada, E. A., & Lada, C. J. 2001, ApJ, 553, L153 [NASA ADS] [CrossRef] [Google Scholar]
- Herbig, G. H. 1972, ApJ, 174, L89 [NASA ADS] [CrossRef] [Google Scholar]
- Kalari, V. M., Vink, J. S., Drew, J. E., et al. 2015, MNRAS, 453, 1026 [NASA ADS] [CrossRef] [Google Scholar]
- Kenyon, S. J., & Hartmann, L. 1995, ApJS, 101, 117 [NASA ADS] [CrossRef] [Google Scholar]
- Meyer, M. R., Calvet, N., & Hillenbrand, L. A. 1997, AJ, 114, 288 [NASA ADS] [CrossRef] [Google Scholar]
- Moitinho, A., Alves, J., Huélamo, N., & Lada, C. J. 2001, ApJ, 563, L73 [NASA ADS] [CrossRef] [Google Scholar]
- Nazé, Y., Rauw, G., & Manfroid, J. 2008, A&A, 483, 171 [NASA ADS] [CrossRef] [EDP Sciences] [Google Scholar]
- Oskinova, L. M., Ignace, R., Hamann, W.-R., Pollock, A. M. T., & Brown, J. C. 2003, A&A, 402, 755 [NASA ADS] [CrossRef] [EDP Sciences] [Google Scholar]
- Prisinzano, L., Damiani, F., Micela, G., & Sciortino, S. 2005, A&A, 430, 941 [NASA ADS] [CrossRef] [EDP Sciences] [Google Scholar]
- Raboud, D. 1996, A&A, 315, 384 [NASA ADS] [Google Scholar]
- Raboud, D. 1999, Rev. Mex. Astron. Astrofis. Conf. Ser., 8, 107 [NASA ADS] [Google Scholar]
- Raboud, D., & Mermilliod, J.-C. 1998, A&A, 333, 897 [NASA ADS] [Google Scholar]
- Rees, R. F., & Cudworth, K. M. 2003, BAAS, 35, 10.06 [Google Scholar]
- Reipurth, B. 2008, Handbook of Star Forming Regions, Vol. II, 5, 401 [Google Scholar]
- Rieke, G. H., & Lebofsky, M. J. 1985, ApJ, 288, 618 [NASA ADS] [CrossRef] [Google Scholar]
- Sana, H., Gosset, E., Rauw, G., Sung, H., & Vreux, J.-M. 2006a, A&A, 454, 1047 [NASA ADS] [CrossRef] [EDP Sciences] [Google Scholar]
- Sana, H., Rauw, G., Nazé, Y., Gosset, E., & Vreux, J.-M. 2006b, MNRAS, 372, 661 [NASA ADS] [CrossRef] [Google Scholar]
- Sana, H., Rauw, G., Sung, H., Gosset, E., & Vreux, J.-M. 2007, MNRAS, 377, 945 [NASA ADS] [CrossRef] [Google Scholar]
- Sana, H., Gosset, E., Nazé, Y., Rauw, G., & Linder, N. 2008, MNRAS, 386, 447 [NASA ADS] [CrossRef] [Google Scholar]
- Sevenster, M. N., Chapman, J. M., Habing, H. J., Killeen, N. E. B., & Lindqvist, M. 1997, A&AS, 124, 509 [NASA ADS] [CrossRef] [EDP Sciences] [Google Scholar]
- Siess, L., Dufour, E., & Forestini, M. 2000, A&A, 358, 593 [Google Scholar]
- Skinner, S. L., Simmons, A. E., Zhekov, S. A., et al. 2006a, ApJ, 639, L35 [NASA ADS] [CrossRef] [Google Scholar]
- Skinner, S., Güdel, M., Schmutz, W., & Zhekov, S. 2006b, Ap&SS, 304, 97 [NASA ADS] [CrossRef] [Google Scholar]
- Skinner, S. L., Zhekov, S. A., Güdel, M., & Schmutz, W. 2007, MNRAS, 378, 1491 [NASA ADS] [CrossRef] [Google Scholar]
- Skinner, S. L., Zhekov, S. A., Güdel, M., Schmutz, W., & Sokal, K. R. 2010, AJ, 139, 825 [NASA ADS] [CrossRef] [Google Scholar]
- Sung, H., Bessell, M. S., & Lee, S.-W. 1998, AJ, 115, 734 (SBL) [NASA ADS] [CrossRef] [Google Scholar]
- Sung, H., Bessell, M. S., & Chun, M.-Y. 2004, AJ, 128, 1684 [NASA ADS] [CrossRef] [Google Scholar]
- Sung, H., Sana, H., & Bessell, M. S. 2013a, AJ, 145, 37 (SSB) [NASA ADS] [CrossRef] [Google Scholar]
- Sung, H., Lim, B., Bessell, M. S., et al. 2013b, J. Korean Astron. Soc., 46, 103 [NASA ADS] [CrossRef] [Google Scholar]
- Weidner, C., Kroupa, P., & Bonnell, I. A. D. 2010, MNRAS, 401, 275 [NASA ADS] [CrossRef] [Google Scholar]
- Zeidler, P., Grebel, E. K., Nota, A., et al. 2016, AJ, 152, 84 [NASA ADS] [CrossRef] [Google Scholar]
- Zhekov, S. A. 2007, MNRAS, 382, 886 [NASA ADS] [CrossRef] [Google Scholar]
Appendix A: Near-IR extinction map
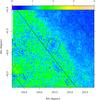 |
Fig. A.1 Spatial map of average J−H color, over a 2° × 2° region around NGC 6231. The top-axis colorbar and labels indicate the correspondence between displayed color and J−H. The two Chandra FOVs are indicated with dashed squares. The three solid lines indicate, left to right, galactic latitudes b = 0,1,2 degrees, respectively. |
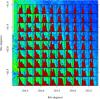 |
Fig. A.2 Same field and background image as in Fig. A.1, with the addition of local J−H histograms. Each histogram covers a J−H range of [0,3]. |
In order to understand better the environment in which NGC 6231 is located, we examine here the distribution of J−H colors of stars over a wider area (2° × 2°). Since the intrinsic stellar J−H falls in the small range [0,1], this permits to estimate roughly the extinction towards the stars within the 2MASS sample in the area. The corresponding spatial map is shown in Fig. A.1, based on more than 400 000 2MASS point sources. At large distances, dominant contributors are red giants, whose intrinsic J−H colors are always close to ~1 (Bessell & Brett 1988). Assuming a ratio E(J−H) /AV = 0.107 (Rieke & Lebofsky 1985) also permits to infer optical extinction values from this map. It is seen that NGC 6231 is surrounded by a region of higher average extinction, and that this increases systematically towards the galactic plane, to the south-east.
However, this is only an oversimplified description, since the true three-dimensional distribution of absorbing material has considerable structure. This can be seen from examining the local distribution of J−H (on regions 10′ × 12′ in size): these local histograms are shown in Fig. A.2, over the same spatial region as above. While at b ~ 2 the distribution has usually a single peak, at the latitudes near NGC 6231 (b ~ 1), including the cluster region itself, it is very often bimodal. Near b ~ 0 an extended red tail is often seen in place of the red peak. The bimodality in the color distribution is an indication of a rapid increase in extinction over a short spatial distance; when the extinction increases smoothly no second peak is produced, like in the lowest-b histograms. In the neighborhood of the cluster, the two J−H peaks are separated by Δ(J−H) ~ 0.7 corresponding to ΔAV ~ 7. The dust density enhancements producing this extra extinction must be located behind the cluster, since this is rather uniformly extincted, as seen above. We cannot determine exactly how far this absorbing layer is from the cluster, but it might be related to residual dust from its parental molecular cloud, and therefore not very far behind it.
Some additional constraint may be obtained from the highly-reddened, background yellow supergiant V870 Sco (F5Ia, Herbig 1972). This star has apparent V = 12.4 and B−V = 3.4 (SSB, star 3926); based on its spectral type and luminosity class, the intrinsic color is (B−V)0 = 0.26 (FitzGerald 1970), and the color excess E(B−V) = 3.14. Assuming RV ~ 3.2, visual extinction is AV = 10.0, and the extinction-corrected V0 = 2.4. Again based on spectral type, the absolute visual magnitude is MV = −8.2 ± 1 (Sung et al. 2013b), and the distance modulus (m−M) = 10.6 ± 1 ( pc). Herbig (1972) remarked that not only this star is much more reddened than NGC 6231 members, but has also a radial velocity incompatible with membership, and is likely a background object, which sets its minimum distance modulus to 11.0. The extinction difference between V870 Sco and NGC 6231 (ΔAV ~ 8.5) must therefore originate between the cluster distance (1585 pc) and the distance of this star (up to 2090 pc, (m−M) = 11.6), and therefore along 500 pc or less. This is a much more rapid AV rise than between us and NGC 6231, in agreement with our considerations above. We are in debt with the referee for calling our attention to this star.
Appendix B: Additional tables
Detected X-ray sources in NGC 6231.
Optical and NIR identifications of X-ray sources, and IR- and Hα-excess stars.
All Tables
X-ray fitting results for combined spectra. Emission-measure units are only relative.
Optical and NIR identifications of X-ray sources, and IR- and Hα-excess stars.
All Figures
|
Fig. 1 Combined Chandra ACIS-I image of NGC 6231, slightly smoothed to emphasize point sources. The field of view of each ACIS-I pointing is 16.9′ × 16.9′, corresponding to 7.81 pc at the cluster distance. Coordinates are equatorial (J2000). |
| In the text | |
|
Fig. 2 Surface density of X-ray sources detected in the ACIS FOV, with more than 20 X-ray counts. The dotted horizontal line is the average surface density of a reference galactic-plane field with nearly the same exposure time as the NGC 6231 field. |
| In the text | |
|
Fig. 3 Spatial distribution of all detected X-ray sources (crosses), and of stars from the SSB optical catalogue (dots) within 15′ of cluster center. The two tilted blue squares are the two ACIS-I FOVs. The dashed line running almost diagonally throughout the figure is the cluster symmetry axis obtained from our principal-component analysis. The Galactic Plane direction is here approximately towards South-East. The big red arrow at top right indicates galactic North. Color codes for X-ray detected sources (crosses) are: blue for OB stars, cyan for A−F (including some B-type) stars, red for low-mass pre-main-sequence stars, purple for field MS stars, magenta for foreground stars, and green for optically unidentified sources. |
| In the text | |
|
Fig. 4 (V,V−I) color−magnitude diagram of all optical stars in the NGC 6231 ACIS FOV. Crosses are X-ray sources, with color codes as in Fig. 3, while dots are X-ray undetected stars. The solid green line is the Siess et al. (2000) ZAMS using the Kenyon & Hartmann (1995; KH95) color transformation, at the cluster distance and reddening. The black polygons are used to define stellar groups, as labeled. The cluster extinction vector is also shown. |
| In the text | |
|
Fig. 5 (V,B−V) color−magnitude diagram of bright stars in NGC 6231. Symbols are as in Fig. 4. When available from SIMBAD, spectral types are indicated. The black line is the KH95 ZAMS, while the red line is a 3 Myr isochrone from Ekström et al. (2012). |
| In the text | |
|
Fig. 6 VPHAS+(r,r−i) CMD. Symbols as in Fig. 3. The adopted definition of additional VPHAS+ stars in the PMS and Field-MS groups is indicated by the polygons. |
| In the text | |
|
Fig. 7 (U−B,B−V) color−color diagram for NGC 6231. Symbols are as in Fig. 4. Orange triangles indicate IR-excess stars, and brown circles Hα-excess stars, see below. |
| In the text | |
|
Fig. 8 PMS band of the cluster CMD with superimposed BHAC and Siess et al. (2000) isochrones of different ages, as labeled. Symbols as in Fig. 4. |
| In the text | |
|
Fig. 9 V magnitude residuals ΔV vs. V−I color, for X-ray detected PMS cluster stars (red crosses). Also shown are the average total errors on ΔV, for comparison (blue segments). |
| In the text | |
|
Fig. 10 Distribution of ΔV for cluster PMS stars. The best-fit model is shown in red. Dashed blue lines indicate the centers of the best-fit Gaussians. |
| In the text | |
|
Fig. 11 Hα index from SSB vs. V−I color. Orange triangles indicate IR-excess stars (see below), and brown circles Hα-excess stars; other symbols as in Fig. 4. The dashed line is our nominal limit to separate CTTS (above it) from WTTS and other non-emission stars. |
| In the text | |
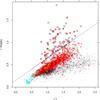 |
Fig. 12 VPHAS+ index r−Hα vs. color r−i. Symbols as in Fig. 11. |
| In the text | |
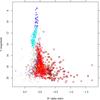 |
Fig. 13 V magnitude vs. index Hα from SSB. Symbols as in Fig. 11. |
| In the text | |
|
Fig. 14 Mixed optical-IR (V−I,H−K) color−color diagram. Symbols are as in Fig. 4. The black (green) solid line is a 5 Myr Siess (BHAC) isochrone for mass M> 0.1 M⊙, the dashed line is our adopted limit to select IR-excess stars. Symbols as in Fig. 11. |
| In the text | |
|
Fig. 15 Optical-IR (r−i,H−K) color−color diagram using VPHAS+ colors. Symbols are as in Fig. 4. The dashed line is our adopted limit to select IR-excess stars (orange triangles). Symbols as in Fig. 11. |
| In the text | |
|
Fig. 16 2MASS (J,J−H) color−magnitude diagram for all IR sources in the ACIS FOV. The blue (green) line is a Siess (BHAC) isochrone at 5 Myr. A representative reddening vector is also shown. Symbols as in Fig. 11. Green crosses are optically unidentified X-ray sources. |
| In the text | |
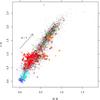 |
Fig. 17 2MASS (J−H,H−K) color−color diagram. Symbols are as in Fig. 4. |
| In the text | |
|
Fig. 18 Cumulative distributions of distances from cluster center for X-ray detected sources in different groups. Only sources with more than 20 counts are included. We also show a spatially uniform, flat distribution as a reference. |
| In the text | |
|
Fig. 19 DSS2-red image of NGC 6231, with superimposed positions of optically-unidentified X-ray sources (green crosses). The boundaries of the two ACIS FOVs are also indicated. |
| In the text | |
|
Fig. 20 Cumulative distributions of distances from cluster center for X-ray undetected sources in different groups. |
| In the text | |
|
Fig. 21 Cumulative distributions of hardness ratio HR1 for non-flaring stars in different groups. |
| In the text | |
|
Fig. 22 Cumulative distributions of hardness ratio HR2 for non-flaring stars in different groups. |
| In the text | |
|
Fig. 23 Cumulative distributions of distances from cluster center for X-ray detected sources in groups 4 (Field-MS) and 6 (unidentified). We show separately hard (HR2 > 0) and soft (HR2 ≤ 0) sources, respectively. The dotted line is a spatially uniform distribution. |
| In the text | |
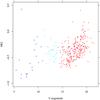 |
Fig. 24 Hardness ratio HR2 vs. V magnitude for OB, A−F, and PMS stars. Symbols as in Fig. 4. |
| In the text | |
|
Fig. 25 Summed X-ray spectra (crosses) of sources in groups 1−5, with model fits. The black and red observed spectra correspond to ObsIds 5372 and 6291, respectively. |
| In the text | |
|
Fig. 26 Summed X-ray spectra of optically unidentified sources with HR2 < 0 (top left) and HR2 > 0 (top right), and of Hα-excess and IR-excess stars (as labeled), with model fits. |
| In the text | |
|
Fig. 27 X-ray spectrum of source #1008 (HD 152270, WR 79), with best-fit 2T model. |
| In the text | |
|
Fig. 28 Plot of X-ray luminosity LX vs. stellar mass. Symbols as in Fig. 4. The dotted horizontal line is our completeness limit. The narrow gap at ~1.4 M⊙ is an artifact corresponding to the transition between the BHAC and Siess et al. (2000) isochrone sets used. |
| In the text | |
|
Fig. 29 Cumulative distributions of time-averaged X-ray count rates for the various groups. The PMS group is shown in its entirety (solid red line), and split between stars respectively brighter (dotted red line) and fainter (dashed red line) than V = 20.5. |
| In the text | |
|
Fig. 30 Ratio LX/Lbol vs. stellar mass. The two dotted lines indicate log LX/Lbol = −3 and − 4, respectively. |
| In the text | |
|
Fig. 31 Kaplan-Meier maximum-likelihood X-ray luminosity functions for members stars in different mass ranges, as indicated. |
| In the text | |
|
Fig. 32 Initial mass function (IMF) of NGC 6231 stars, computed under different assumptions on star membership, as explained in the text. Dotted lines are linear best fits to the black IMF (black dotted line) and to the green one (green dotted line). The blue dashed line is the Chabrier (2003) model IMF, with arbitrary normalization. |
| In the text | |
|
Fig. 33 Mass vs. X-ray count rate for PMS members. The dashed line is obtained from a principal-component analysis. Only non-flaring X-ray sources are shown, within 4 arcmin from cluster center. |
| In the text | |
|
Fig. 34 Optical CMD of XMM-Newton X-ray sources falling outside our Chandra FOV (red crosses). The same loci as in Fig. 4 are indicated in black. The green line is the ZAMS at the cluster distance, while in blue are BHAC evolutionary tracks for stars of masses M = 0.5,1,1.4 M⊙. |
| In the text | |
|
Fig. A.1 Spatial map of average J−H color, over a 2° × 2° region around NGC 6231. The top-axis colorbar and labels indicate the correspondence between displayed color and J−H. The two Chandra FOVs are indicated with dashed squares. The three solid lines indicate, left to right, galactic latitudes b = 0,1,2 degrees, respectively. |
| In the text | |
|
Fig. A.2 Same field and background image as in Fig. A.1, with the addition of local J−H histograms. Each histogram covers a J−H range of [0,3]. |
| In the text | |
Current usage metrics show cumulative count of Article Views (full-text article views including HTML views, PDF and ePub downloads, according to the available data) and Abstracts Views on Vision4Press platform.
Data correspond to usage on the plateform after 2015. The current usage metrics is available 48-96 hours after online publication and is updated daily on week days.
Initial download of the metrics may take a while.