Free Access
Fig. 18
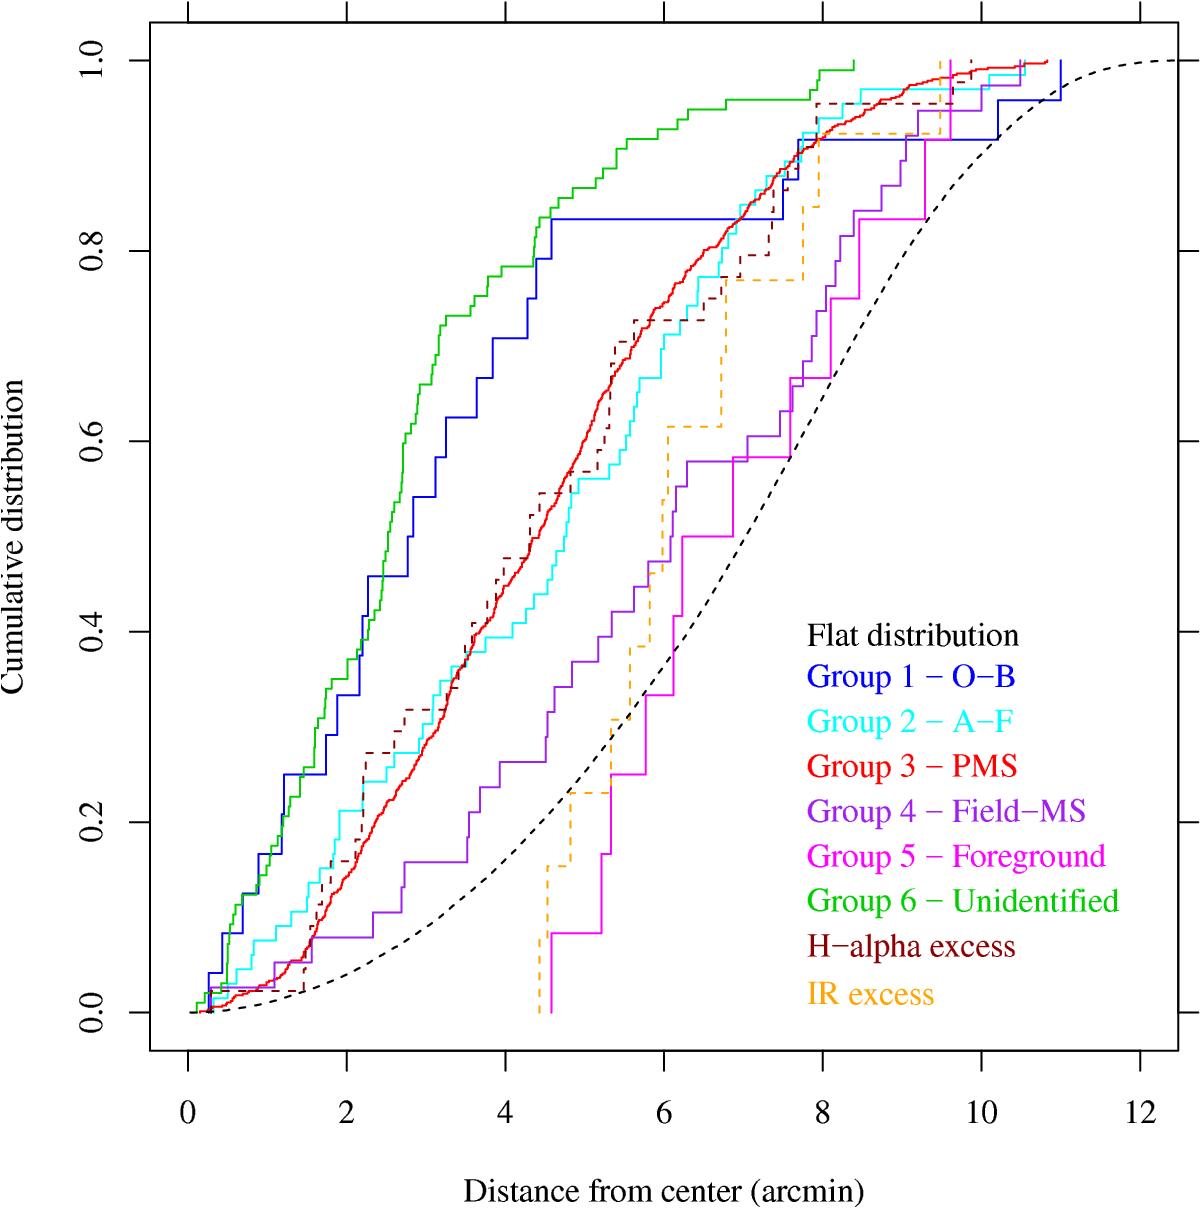
Cumulative distributions of distances from cluster center for X-ray detected sources in different groups. Only sources with more than 20 counts are included. We also show a spatially uniform, flat distribution as a reference.
Current usage metrics show cumulative count of Article Views (full-text article views including HTML views, PDF and ePub downloads, according to the available data) and Abstracts Views on Vision4Press platform.
Data correspond to usage on the plateform after 2015. The current usage metrics is available 48-96 hours after online publication and is updated daily on week days.
Initial download of the metrics may take a while.