Fig. 10
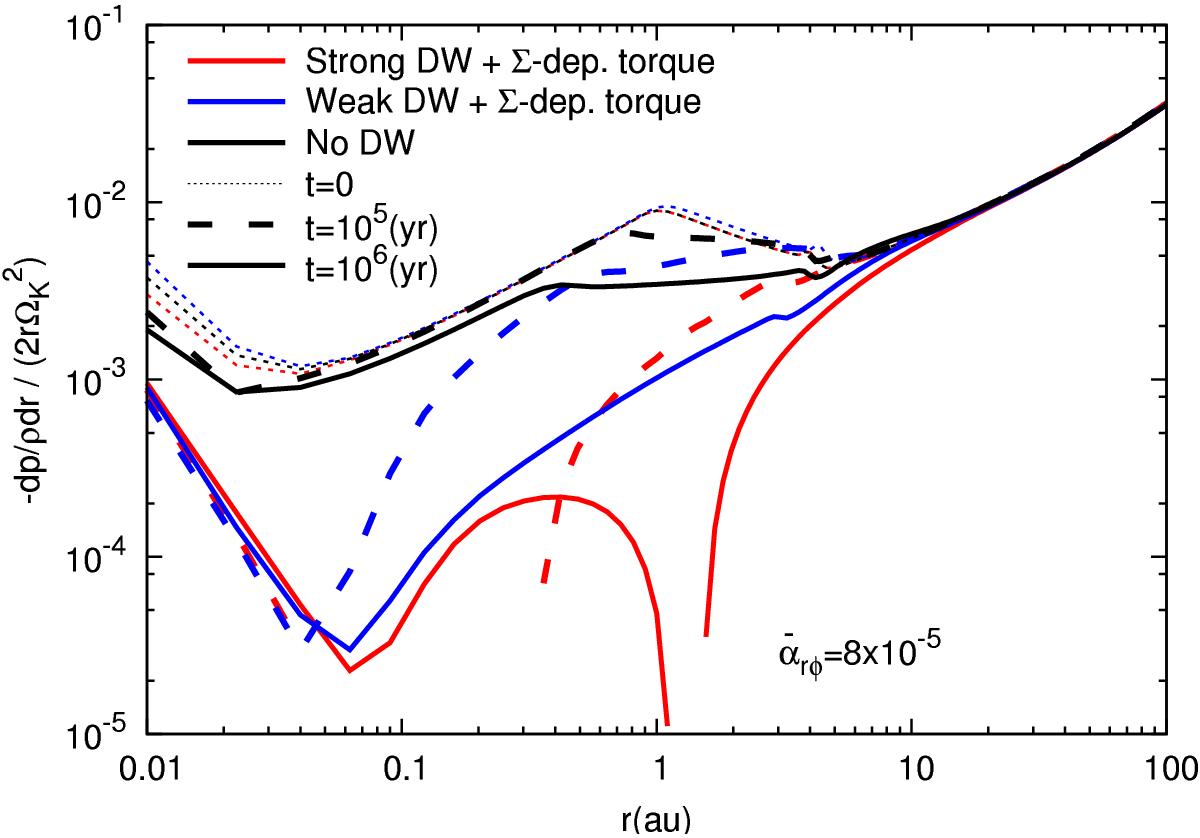
Comparison of normalized pressure gradient force, ![]() , of MRI-inactive PPDs at t = 0 (dotted), 105 (solid), and 106 yr (dashed). The MRI-inactive cases with Σ-dependent torque in Table 2, blue lines for weak DW and red lines for strong DW, which corresponds to the red and blue lines in Fig. 5, are compared to the MRI-inactive no DW case with Cw,0 = 0 and
, of MRI-inactive PPDs at t = 0 (dotted), 105 (solid), and 106 yr (dashed). The MRI-inactive cases with Σ-dependent torque in Table 2, blue lines for weak DW and red lines for strong DW, which corresponds to the red and blue lines in Fig. 5, are compared to the MRI-inactive no DW case with Cw,0 = 0 and ![]() (black lines).
(black lines).
Current usage metrics show cumulative count of Article Views (full-text article views including HTML views, PDF and ePub downloads, according to the available data) and Abstracts Views on Vision4Press platform.
Data correspond to usage on the plateform after 2015. The current usage metrics is available 48-96 hours after online publication and is updated daily on week days.
Initial download of the metrics may take a while.