Fig. 1
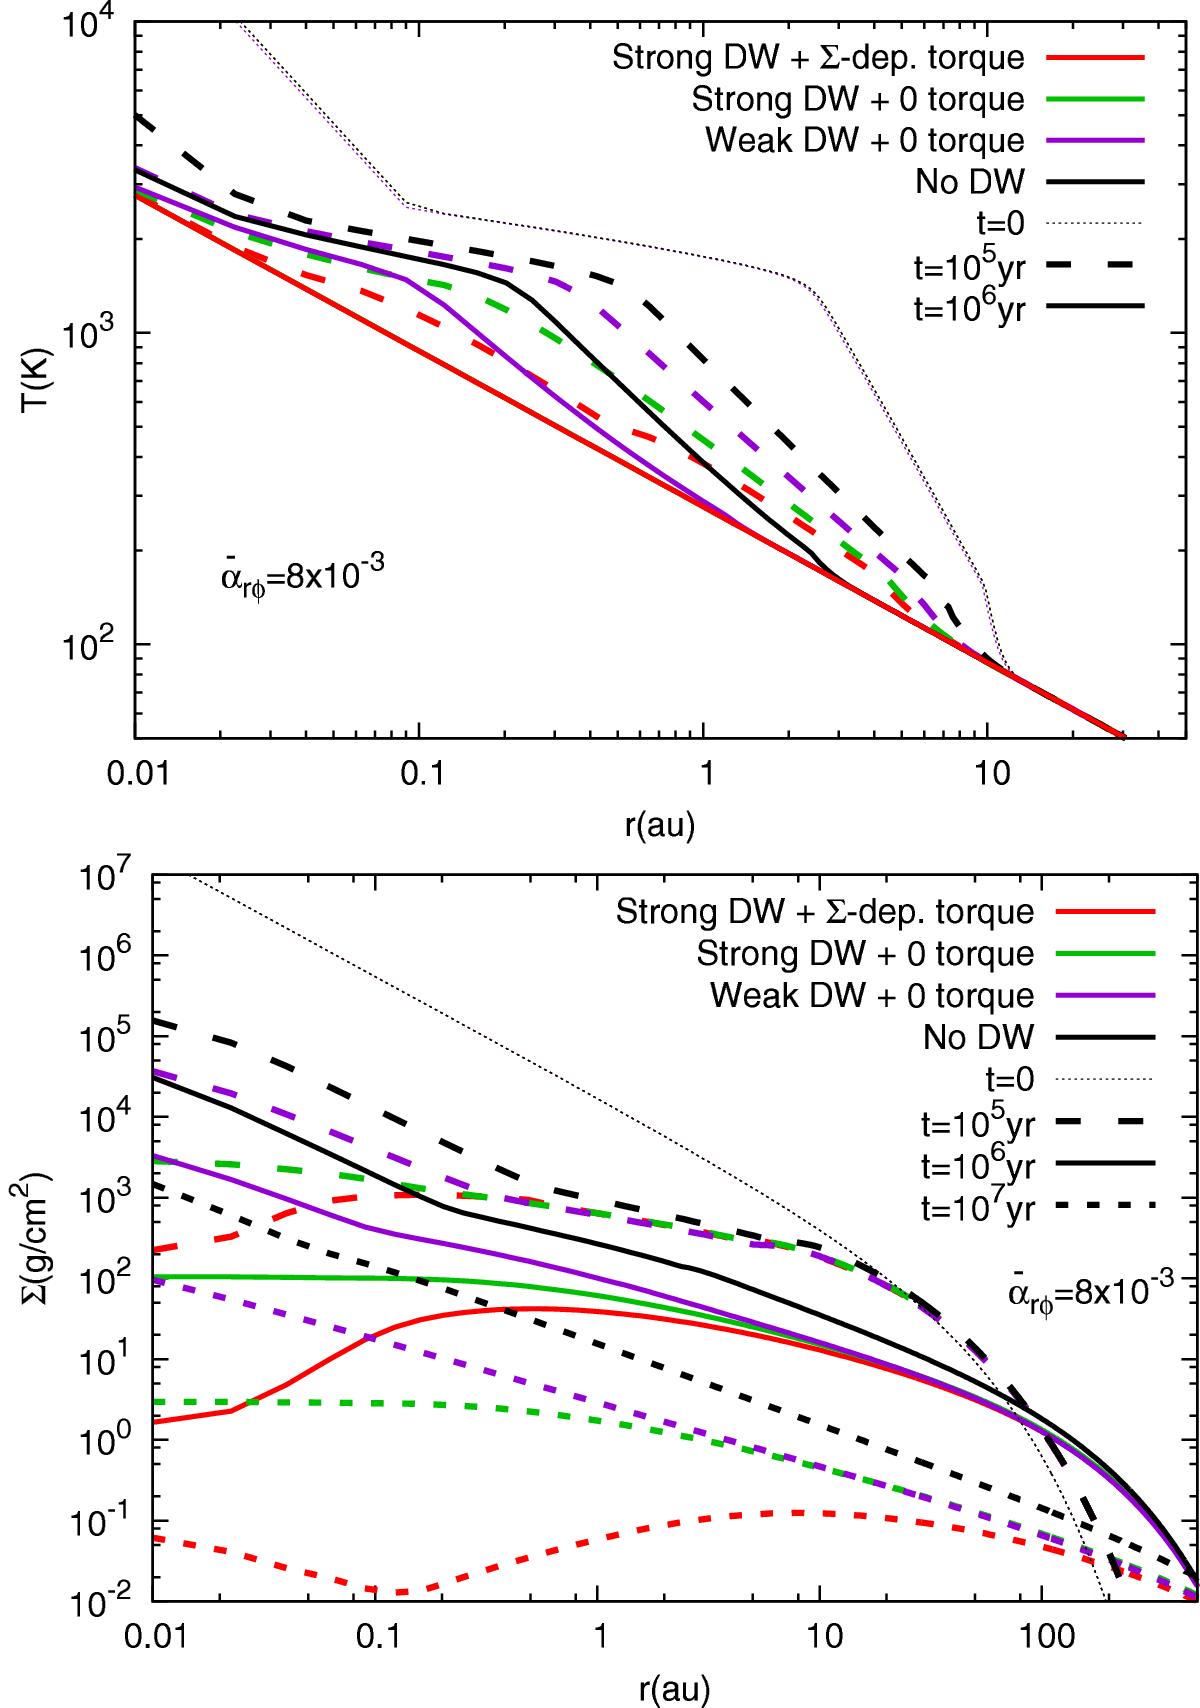
Comparison of time evolutions of four MRI-active PPDs with ![]() . The four cases are (i) strong DW + Σ-dependent torque (red); (ii) strong DW + zero-torque (green); (iii) weak DW + zero-torque (purple); and (iv) no DW (black), summarized in Table 1. Top: radial profiles of temperatures, T, at t = 0 (dotted lines), 105 (dashed lines), and 106 (solid lines) years. We note that the initial temperatures of the four cases are almost the same and that the red and green solid lines at t = 106 yr overlap at T = Treq (Eq. (27)). Bottom: radial profiles of surface densities, Σ, at t = 0 (dotted lines), 105 (long dashed lines), 106 (solid lines), and 107 (short dashed lines) years. We note that the radial range of the top panel is more zoomed-in than the radial range of the bottom panel.
. The four cases are (i) strong DW + Σ-dependent torque (red); (ii) strong DW + zero-torque (green); (iii) weak DW + zero-torque (purple); and (iv) no DW (black), summarized in Table 1. Top: radial profiles of temperatures, T, at t = 0 (dotted lines), 105 (dashed lines), and 106 (solid lines) years. We note that the initial temperatures of the four cases are almost the same and that the red and green solid lines at t = 106 yr overlap at T = Treq (Eq. (27)). Bottom: radial profiles of surface densities, Σ, at t = 0 (dotted lines), 105 (long dashed lines), 106 (solid lines), and 107 (short dashed lines) years. We note that the radial range of the top panel is more zoomed-in than the radial range of the bottom panel.
Current usage metrics show cumulative count of Article Views (full-text article views including HTML views, PDF and ePub downloads, according to the available data) and Abstracts Views on Vision4Press platform.
Data correspond to usage on the plateform after 2015. The current usage metrics is available 48-96 hours after online publication and is updated daily on week days.
Initial download of the metrics may take a while.