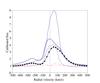
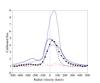
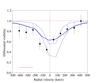
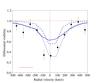
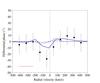
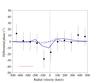
Fig. 5
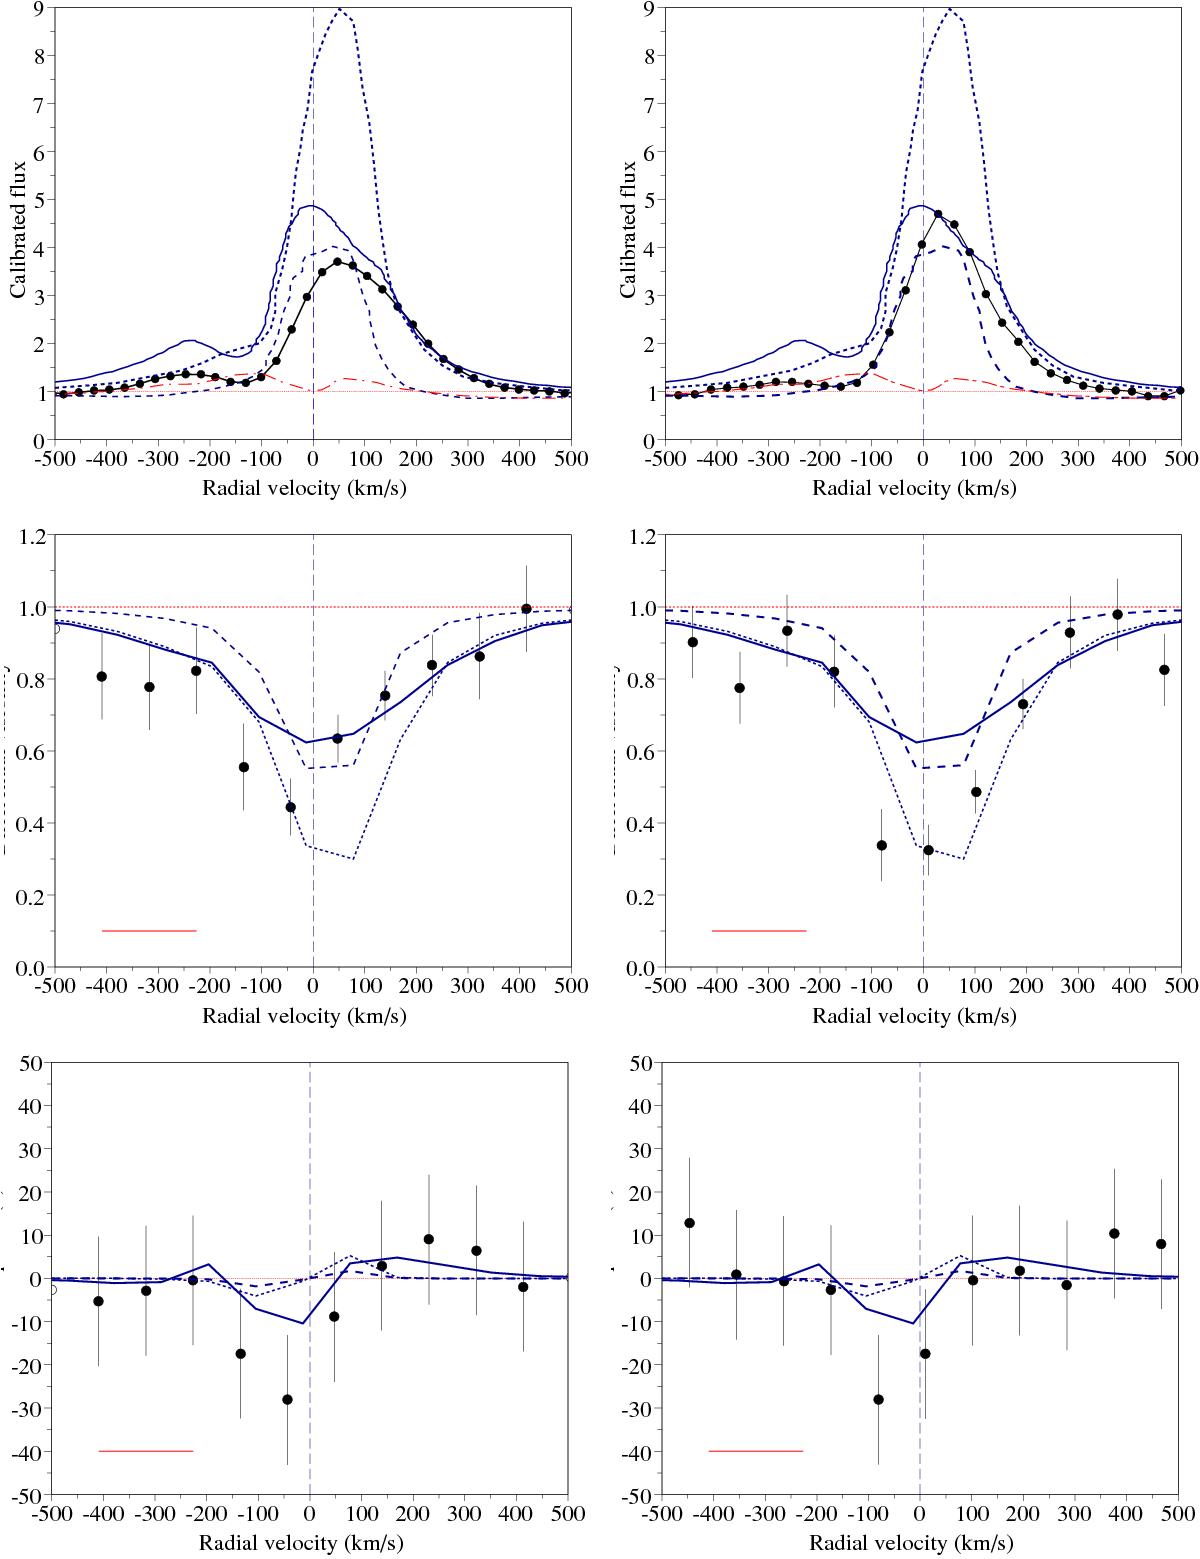
Modeling of the VEGA observations on 2010 October 17 (left) and 2012 September 21 (right). Top: observed (black circles) and modeled spectra for all disk-wind models (M1: dashed line; M2: dotted line; M3: solid line). The dash-dotted red line indicates the contribution of the magnetosphere to the profile for M3. Middle: same for differential visibilities. Bottom: same for differential phases. The spectral bin is represented by the red line in the bottom corner of each panel.
Current usage metrics show cumulative count of Article Views (full-text article views including HTML views, PDF and ePub downloads, according to the available data) and Abstracts Views on Vision4Press platform.
Data correspond to usage on the plateform after 2015. The current usage metrics is available 48-96 hours after online publication and is updated daily on week days.
Initial download of the metrics may take a while.