Fig. 9

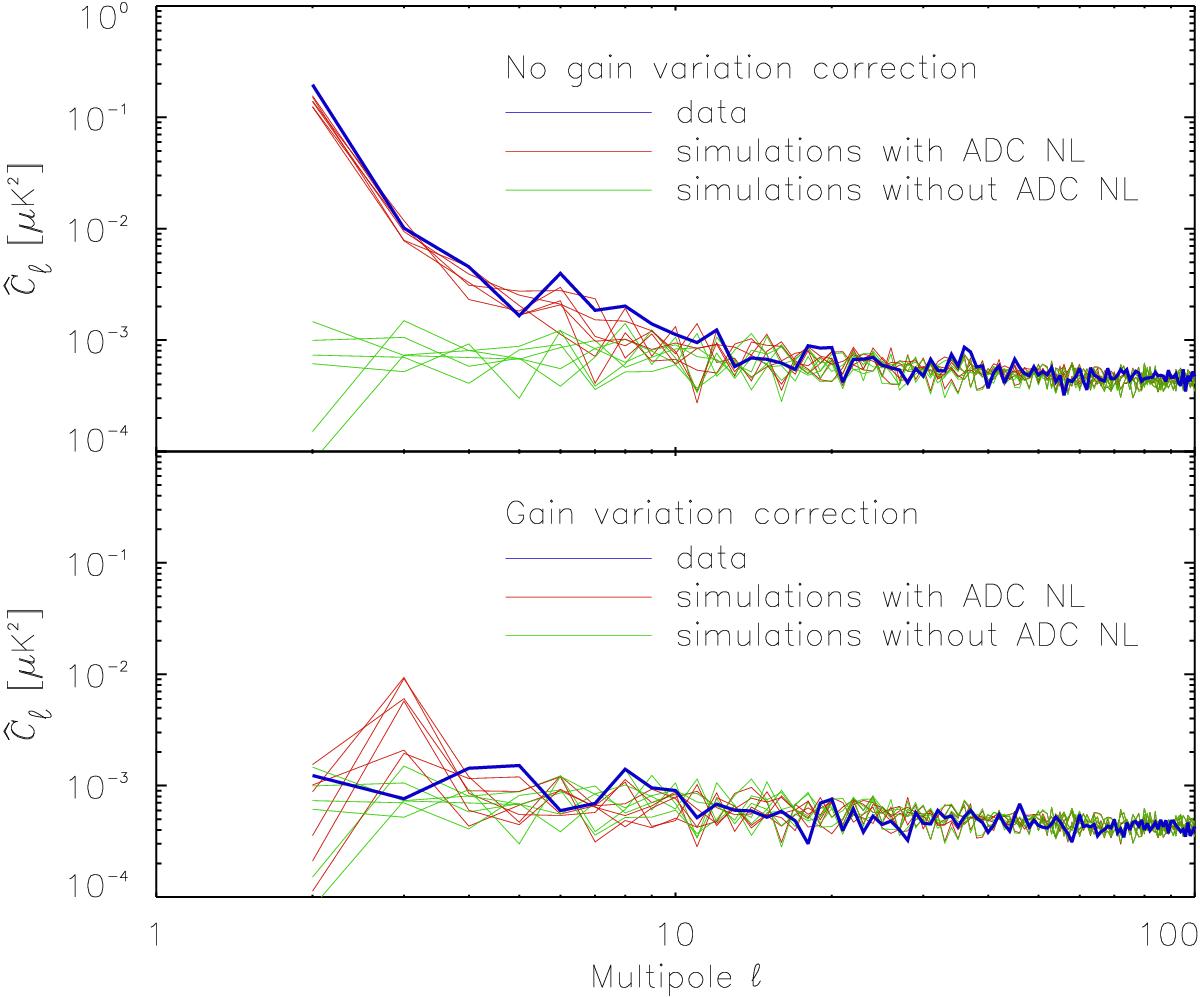
Power spectra of the 100-GHz half-mission null-test maps shown in Fig. B.14, which are dominated by ADC non-linearity effects. We compare six simulations at 100 GHz drawn from the Sroll uncertainties (red lines), and the average for the full frequency 100-GHz data (blue line). In the top panel only the TOI non-linearity correction is applied. In the bottom panel, both the TOI correction and the time-varying gain correction are applied. This leaves only the dipole distortion. For both panels the green lines are for simulations without the ADC non-linearity effect (only noise and other systematic residuals).
Current usage metrics show cumulative count of Article Views (full-text article views including HTML views, PDF and ePub downloads, according to the available data) and Abstracts Views on Vision4Press platform.
Data correspond to usage on the plateform after 2015. The current usage metrics is available 48-96 hours after online publication and is updated daily on week days.
Initial download of the metrics may take a while.


