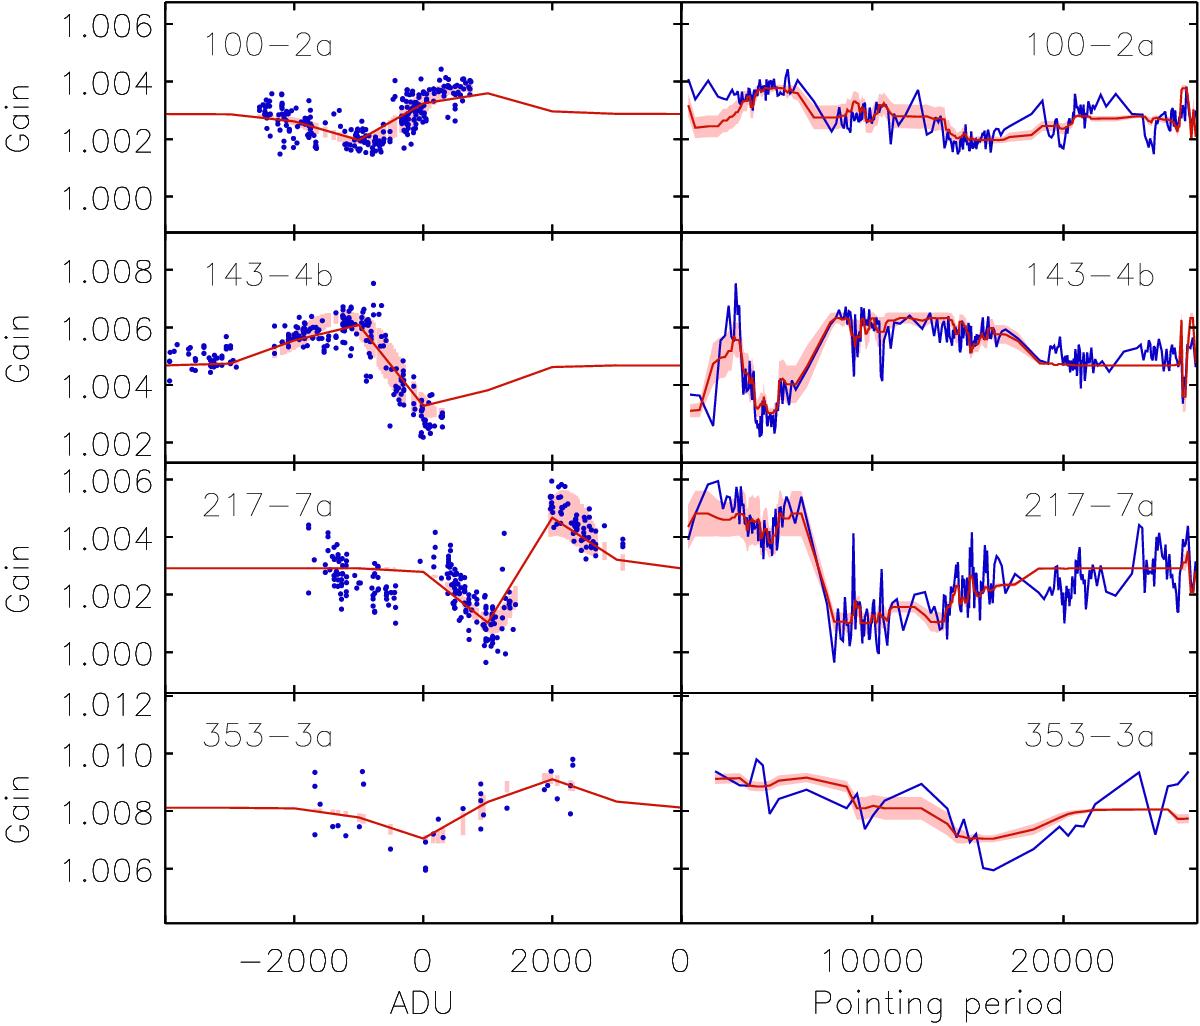
Fig. B.6

Evolution of the gain solved by SRoll for four representative bolometers. The left column shows gain as a function of signal level in ADU, with values determined from the data in blue. The red line is the best fit, and the pink area surrounding it is the standard deviation of a four-parameter model of the residual ADC non-linearity fitted to these data. The right column shows gain as a function of pointing period, and shows that the model is able to reproduce the broad features of the remaining gain variation observed during the mission.
Current usage metrics show cumulative count of Article Views (full-text article views including HTML views, PDF and ePub downloads, according to the available data) and Abstracts Views on Vision4Press platform.
Data correspond to usage on the plateform after 2015. The current usage metrics is available 48-96 hours after online publication and is updated daily on week days.
Initial download of the metrics may take a while.


