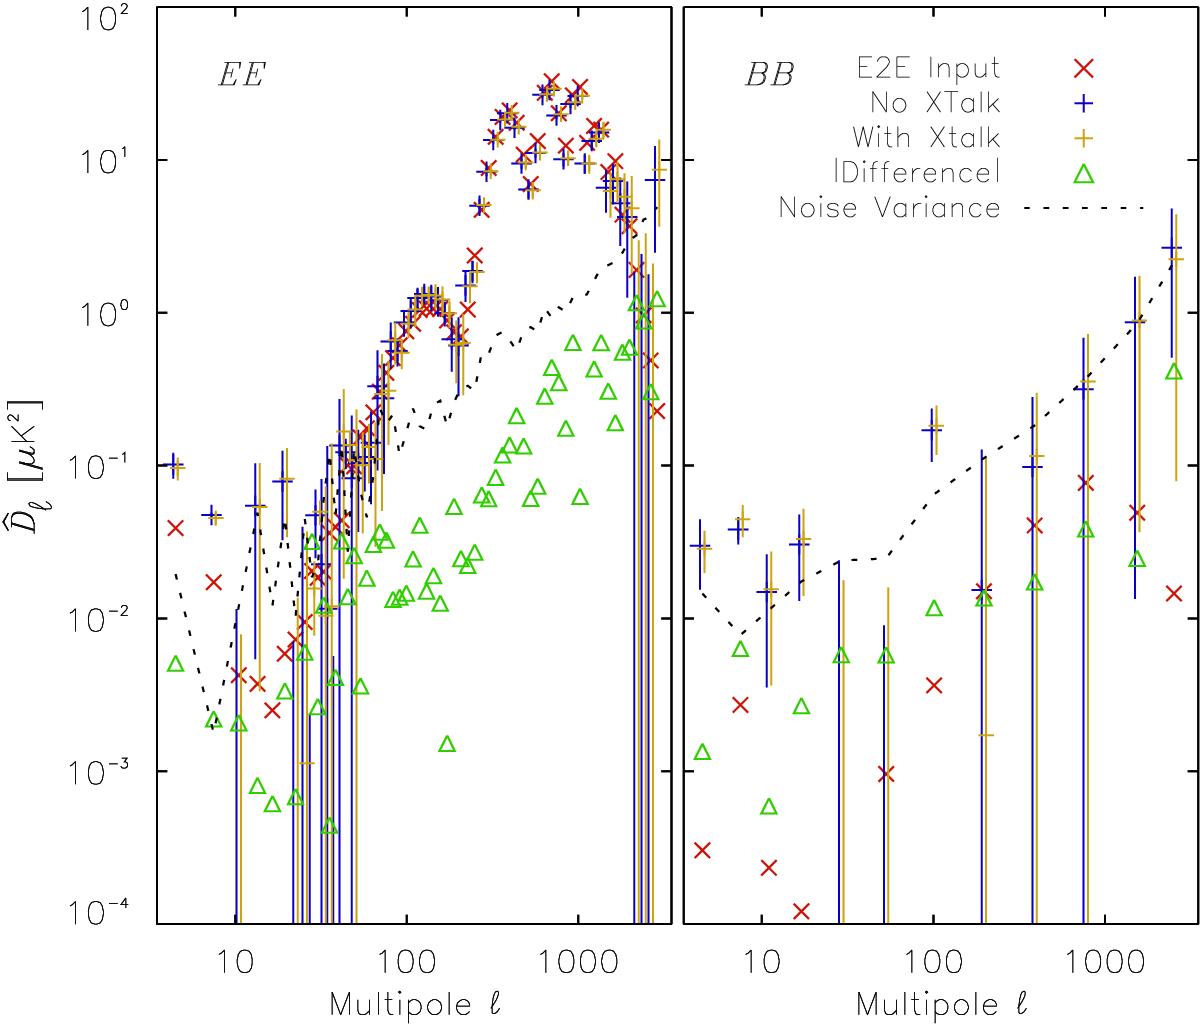
Fig. A.3

Auto-power spectra EE (left) and BB (right) of the 217 GHz end-to-end simulations carried out to test the effects of detector crosstalk. Red crosses indicate the F-EE sky signal input to the simulation, to which a realization drawn from the noise variance is added (dashed black). The orange and blue crosses show the total power in the simulations, with and without simulated crosstalk, respectively. The absolute value of the difference (between the simulations including crosstalk and those without crosstalk) is shown in green. We note the difference in binning data between left and right plots.
Current usage metrics show cumulative count of Article Views (full-text article views including HTML views, PDF and ePub downloads, according to the available data) and Abstracts Views on Vision4Press platform.
Data correspond to usage on the plateform after 2015. The current usage metrics is available 48-96 hours after online publication and is updated daily on week days.
Initial download of the metrics may take a while.


