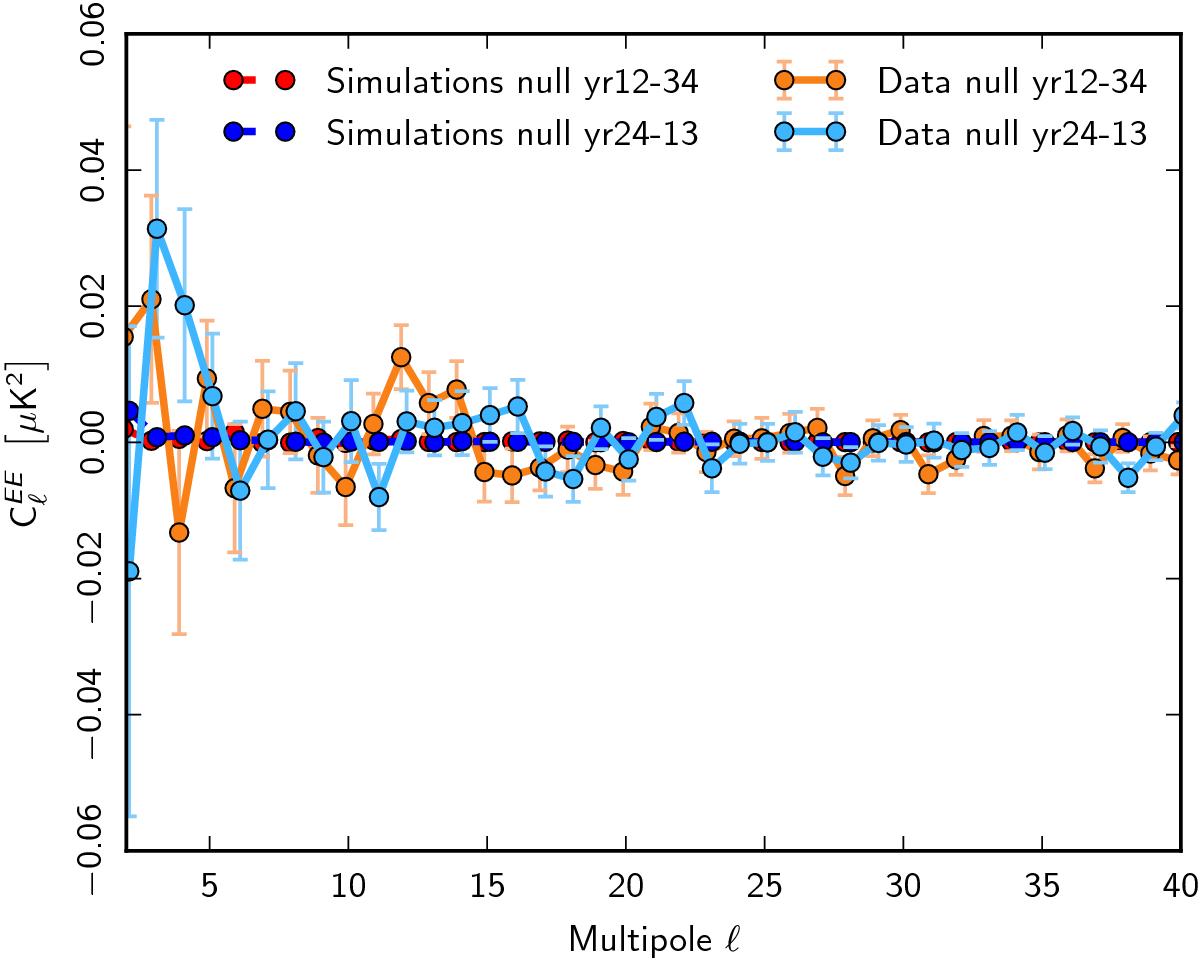
Fig. 25

Power spectrum of the measured 70-GHz null maps for the differences D12−34 (orange) and D24−13 (light blue). The scatter is dominated by the measurement noise. The error bars are computed from 1000 Monte Carlo simulations from FFP8 noise. Negative values are due to the fact that the noise bias has been removed. For comparison we also plot the systematics-only spectra (red and blue).
Current usage metrics show cumulative count of Article Views (full-text article views including HTML views, PDF and ePub downloads, according to the available data) and Abstracts Views on Vision4Press platform.
Data correspond to usage on the plateform after 2015. The current usage metrics is available 48-96 hours after online publication and is updated daily on week days.
Initial download of the metrics may take a while.


