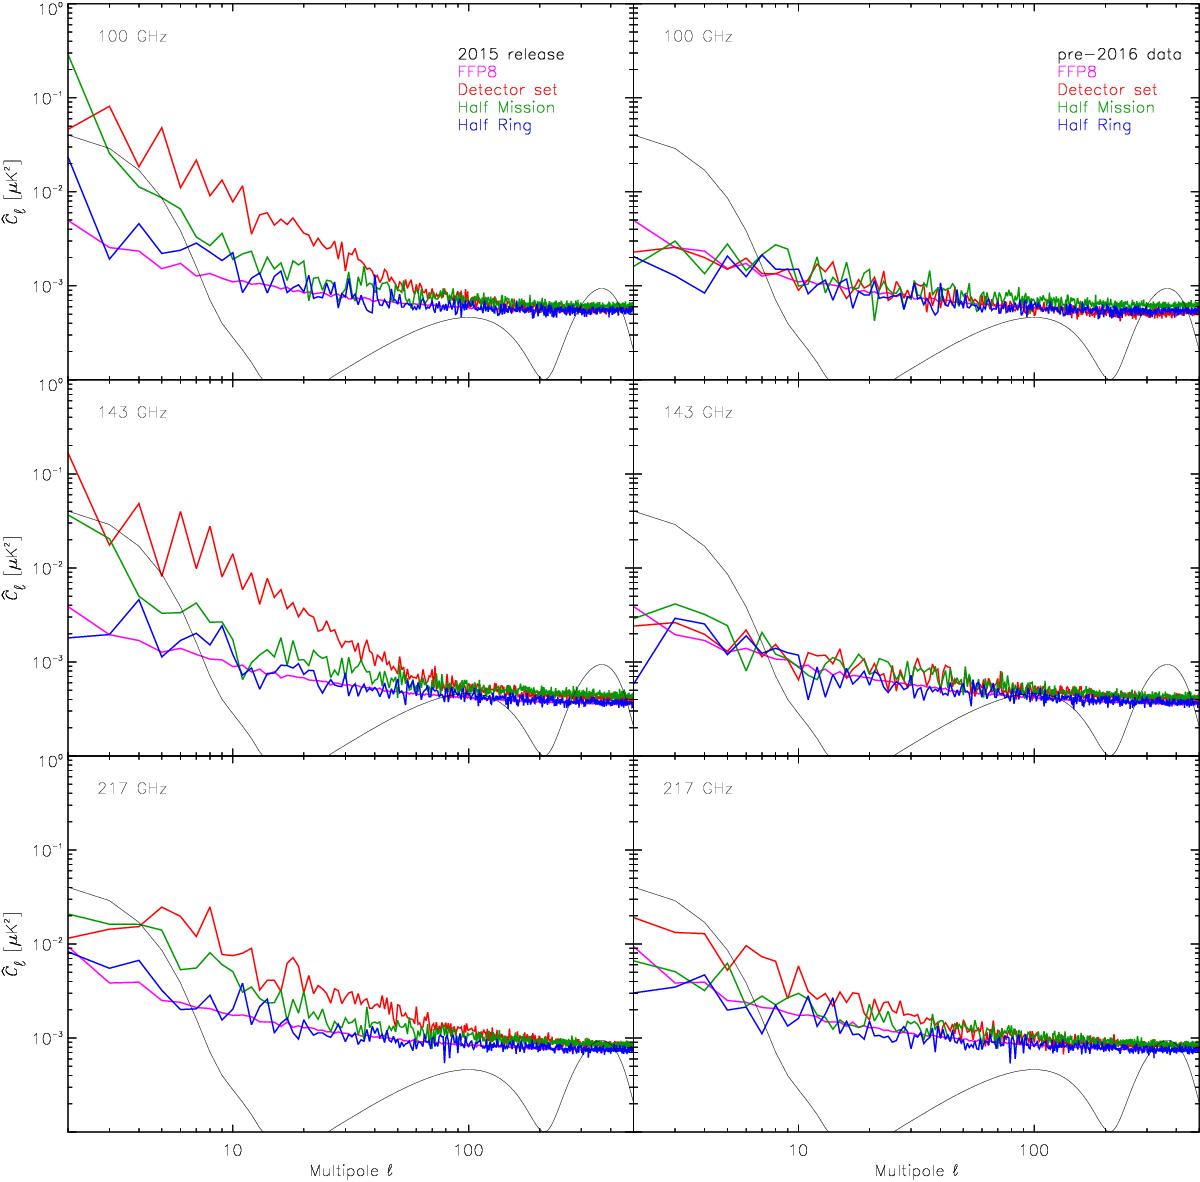
Fig. 18

EE auto-power-spectra of detector-set, half-mission, and half-ring difference maps for 100, 143, and 217 GHz. Cℓ rather than Dℓ is plotted here to emphasize low multipoles. Results from the Planck 2015 data release are on the left; results from the pre-2016 maps described in this paper are on the right. Colour-coding is the same for all frequencies. We also show for reference an average of FFP8 simulations boosted by 20% to fit the half-ring null tests. The black curves show the F-EE model.
Current usage metrics show cumulative count of Article Views (full-text article views including HTML views, PDF and ePub downloads, according to the available data) and Abstracts Views on Vision4Press platform.
Data correspond to usage on the plateform after 2015. The current usage metrics is available 48-96 hours after online publication and is updated daily on week days.
Initial download of the metrics may take a while.


