Fig. 2
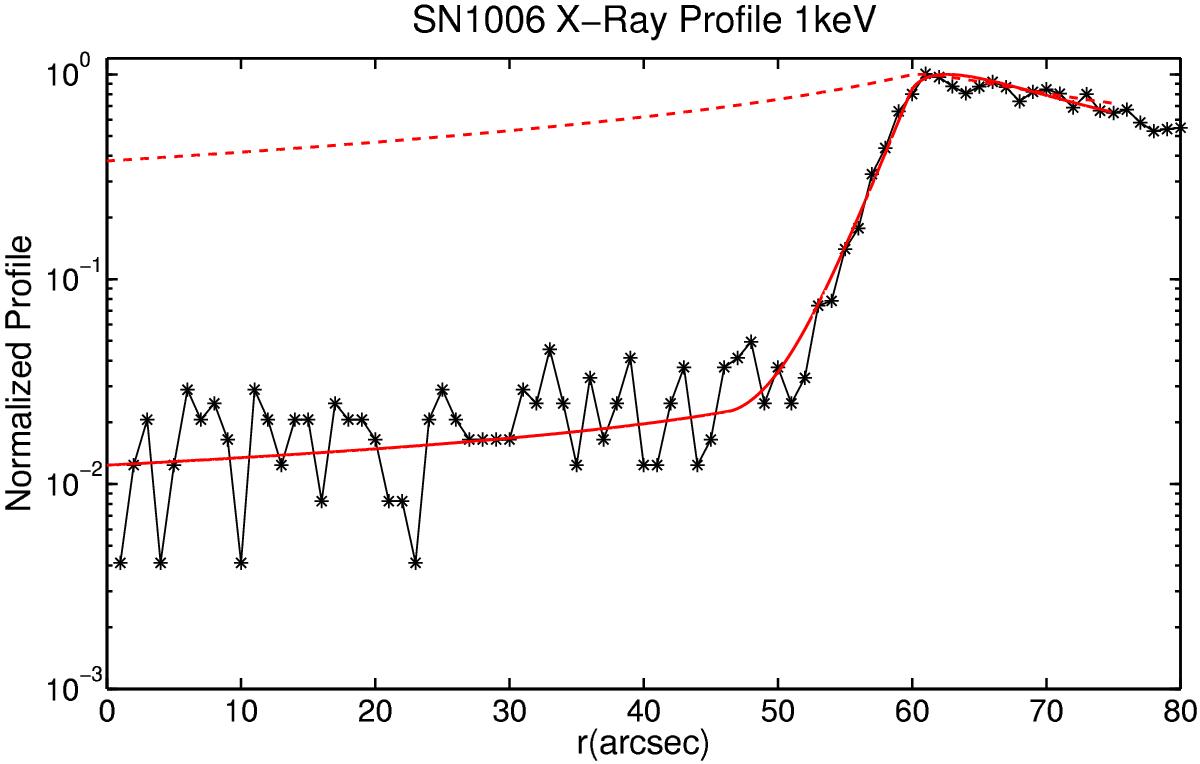
Radial profile of the emission at about 1 keV for the SN1006 remnant in logarithmic scale (asterisks). The thick red line corresponds to the model integrated along the line of sight for synchrotron-loss-dominated transport downstream, diffusive transport close upstream (as in Fig. 1), and superdiffusive transport far upstream (in the flatter tail of the profile). The dashed red line corresponds to the model integrated along the line of sight for synchrotron-loss-dominated transport downstream, and a profile following the modeling by Bell (1978) upstream. The profile refers to the filament shown in Fig.1 of Morlino et al. (2010).
Current usage metrics show cumulative count of Article Views (full-text article views including HTML views, PDF and ePub downloads, according to the available data) and Abstracts Views on Vision4Press platform.
Data correspond to usage on the plateform after 2015. The current usage metrics is available 48-96 hours after online publication and is updated daily on week days.
Initial download of the metrics may take a while.