Fig. 5
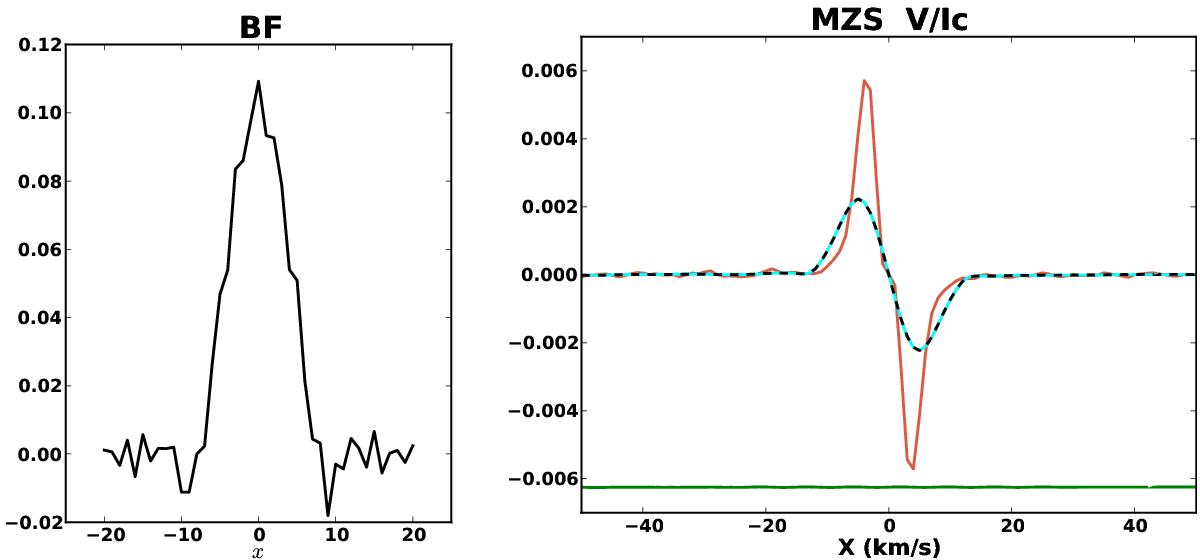
Left panel: optimal BF, derived with 41 eigenvectors. Right panel: MZS profiles. The red line represents the solar MZS (v sini = 0 km s-1), the dashed black line the stellar MZS (v sini = 10 km s-1), and the solid line in cyan the result of the application of the BF to the solar MZS. The green line at the bottom of the panel, shifted for clarity’s sake, represents the difference between the solar broadened MZS and the stellar MZS. The stellar Stokes profiles were calculated using Model 1, a dipolar magnetic moment of m = 400 G and a fixed grid of 440 quadrature points.
Current usage metrics show cumulative count of Article Views (full-text article views including HTML views, PDF and ePub downloads, according to the available data) and Abstracts Views on Vision4Press platform.
Data correspond to usage on the plateform after 2015. The current usage metrics is available 48-96 hours after online publication and is updated daily on week days.
Initial download of the metrics may take a while.