Free Access
Fig. 14
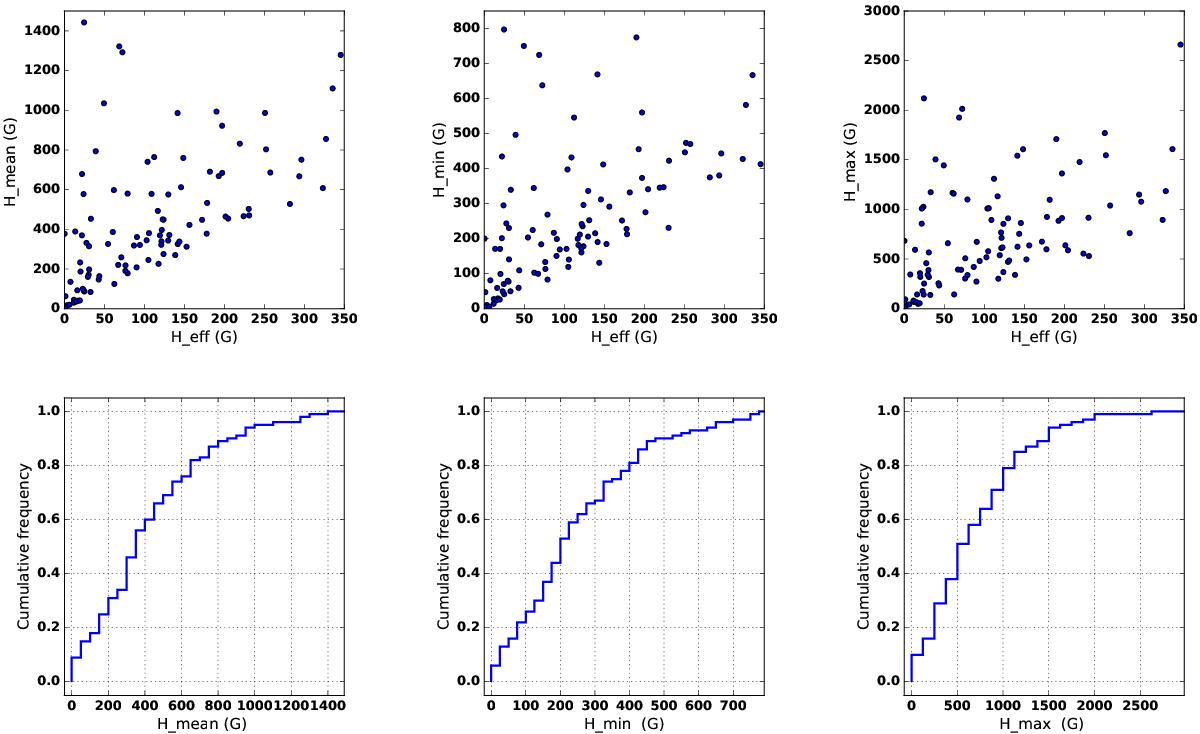
Upper panels, from left to right: mean, minimum and maximum surface values of the field modulus as a function of the absolute value of Heff for the set of 100 MZSs used in the inversion test of Fig. 10. Lower panels: respective cumulative histograms.
Current usage metrics show cumulative count of Article Views (full-text article views including HTML views, PDF and ePub downloads, according to the available data) and Abstracts Views on Vision4Press platform.
Data correspond to usage on the plateform after 2015. The current usage metrics is available 48-96 hours after online publication and is updated daily on week days.
Initial download of the metrics may take a while.