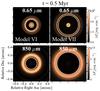
Fig. 8

Left part: synthetic images at 0.65 μm (polarised intensity, top panels) and at 850 μm (bottom panels) obtained after radiative transfer calculations using the dust density distributions obtained from models VI and VII (Fig. 5) at 0.5 Myr of evolution. Circles at 20 au in the left and 40 au in the right (assuming 140 pc distance) are also shown for reference. Right part: radial intensity profile at 850 μm from the model images of models V, VI, and VII at different times of evolution ([0.1,0.5,1] Myr).
Current usage metrics show cumulative count of Article Views (full-text article views including HTML views, PDF and ePub downloads, according to the available data) and Abstracts Views on Vision4Press platform.
Data correspond to usage on the plateform after 2015. The current usage metrics is available 48-96 hours after online publication and is updated daily on week days.
Initial download of the metrics may take a while.