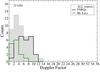
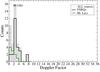
Fig. 5
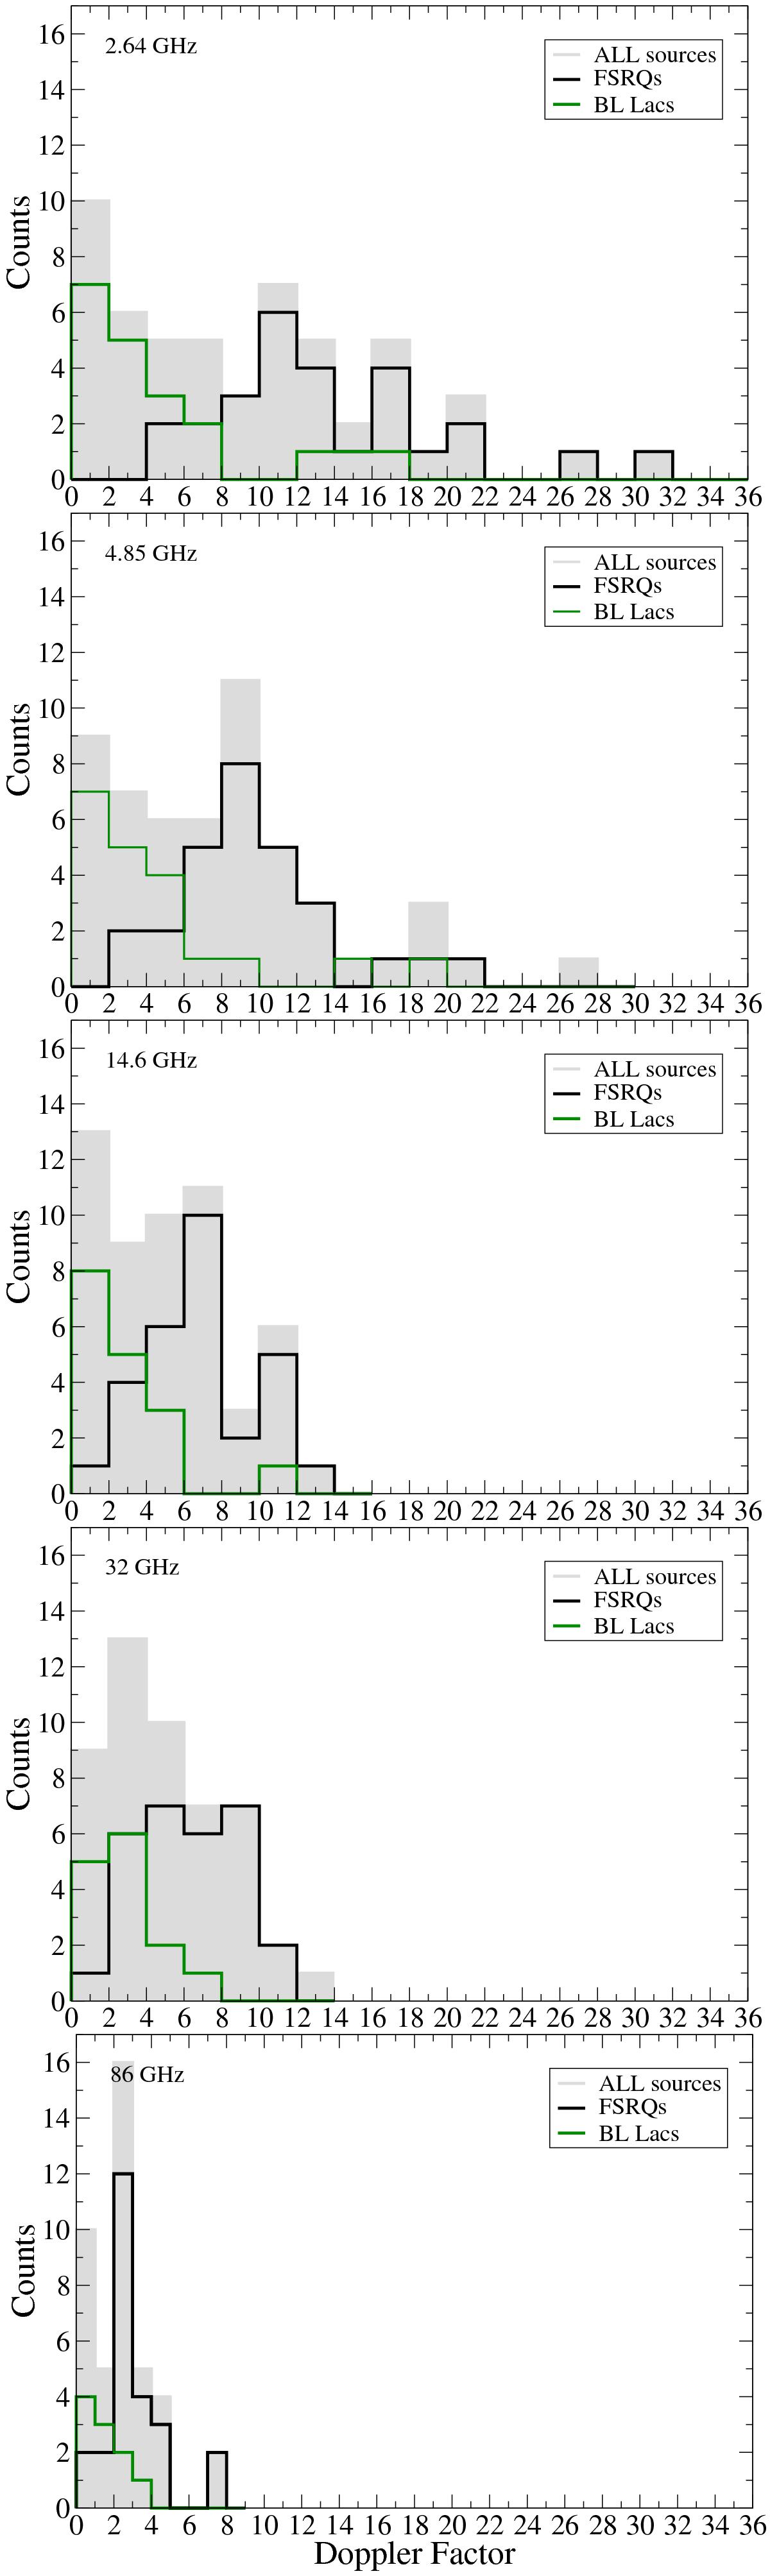
Distributions of variability Doppler factors δvar,eq at selected frequencies: 2.64, 4.85, 14.6, 32, and 86 GHz from top to bottom. All sources (grey) are shown with FSRQs (black) and BL Lacs (green) superimposed. We note the systematic decrease of δvar,eq towards higher frequencies as well as the difference in the sample between FSRQs and BL Lacs (see text).
Current usage metrics show cumulative count of Article Views (full-text article views including HTML views, PDF and ePub downloads, according to the available data) and Abstracts Views on Vision4Press platform.
Data correspond to usage on the plateform after 2015. The current usage metrics is available 48-96 hours after online publication and is updated daily on week days.
Initial download of the metrics may take a while.